
Despite an optimistic market, Bitcoin fell by 8.4% over the last 24 hours. The effects of this fall were observed on the market’s altcoins as well, with the likes of Dogecoin, Polkadot, and Uniswap noting some corrections.
Uniswap made some headlines earlier today by becoming the first exchange to be supported by CoinMarketCap’s newly launched token swap feature.
Dogecoin [DOGE]
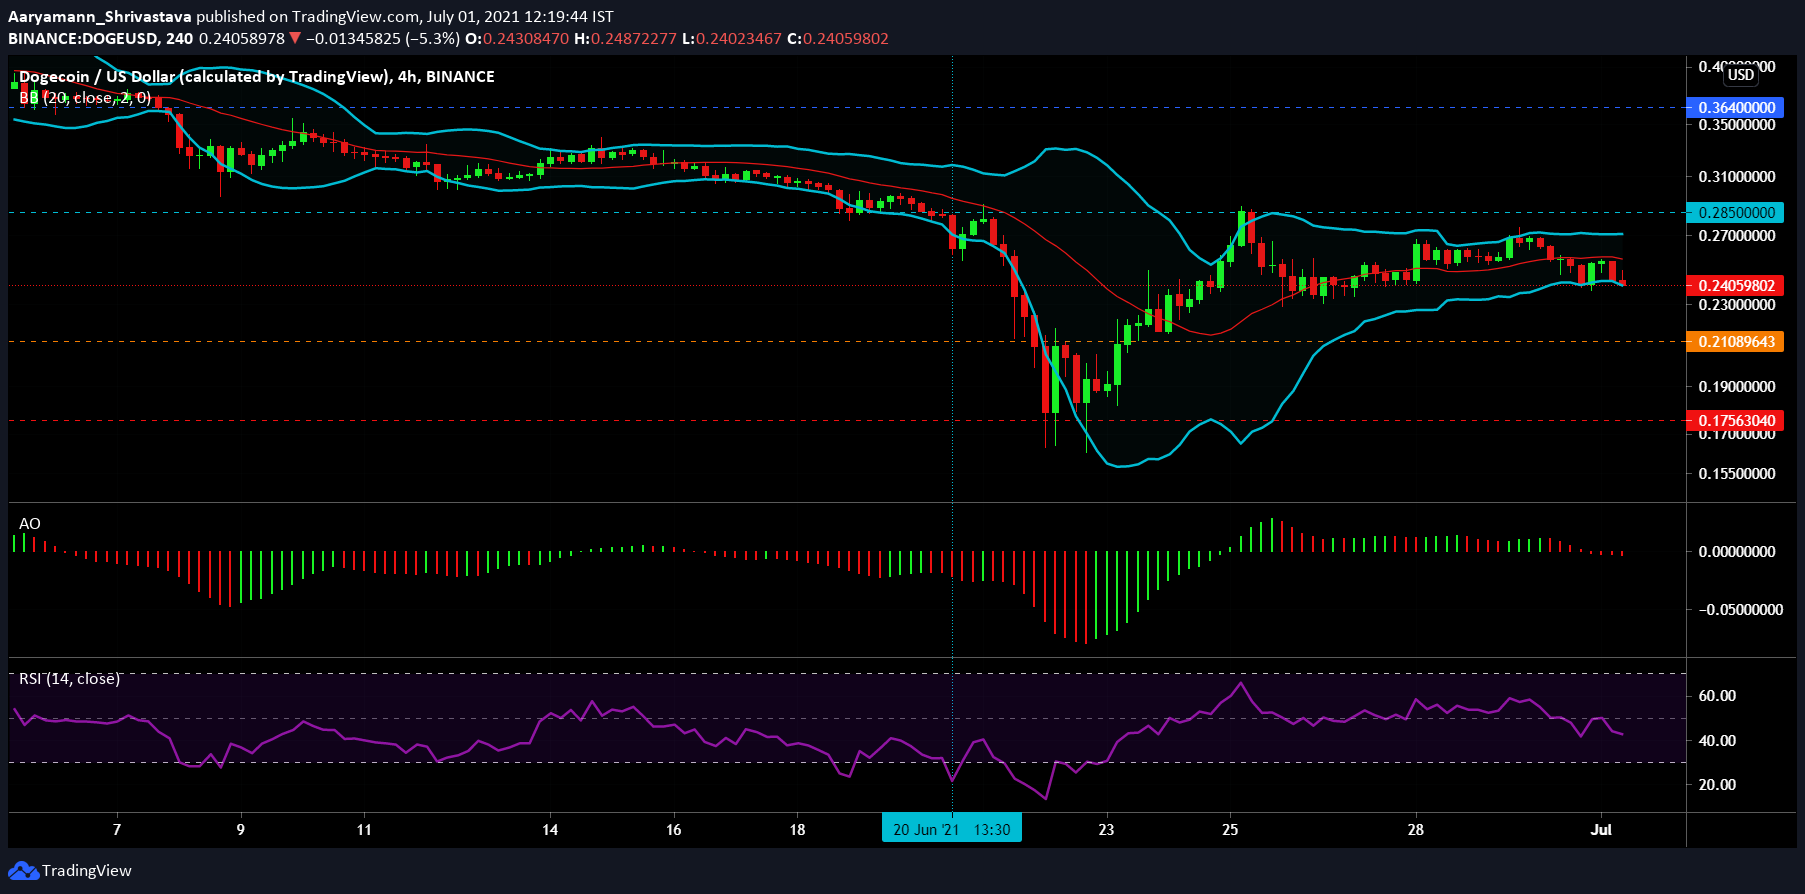
Source: DOGE/USD – TradingView
On June 28, Elon Musk’s birthday, Dogecoin pictured a strong hike of 8.6%. Since then, however, the coin has gone back down to its price levels before the said date. At press time, DOGE was trading at $0.24. For over two weeks, the alt continued to consolidate within the $0.285 and $0.21 levels, and it will likely continue doing so.
The Bollinger Bands had remained parallel for the last few trading sessions, but at the time of this report, a slight convergence towards the lower band was observed.
The Awesome Oscillator saw bearish momentum dominating as red bars continued to follow the green bars. The Relative Strength Index (RSI) could be seen heading towards the bearish neutral zone, closer to 40.0
While the indicators did hint at a price fall going forward, the crypto may still stay above the $0.21-mark.
Polkadot [DOT]
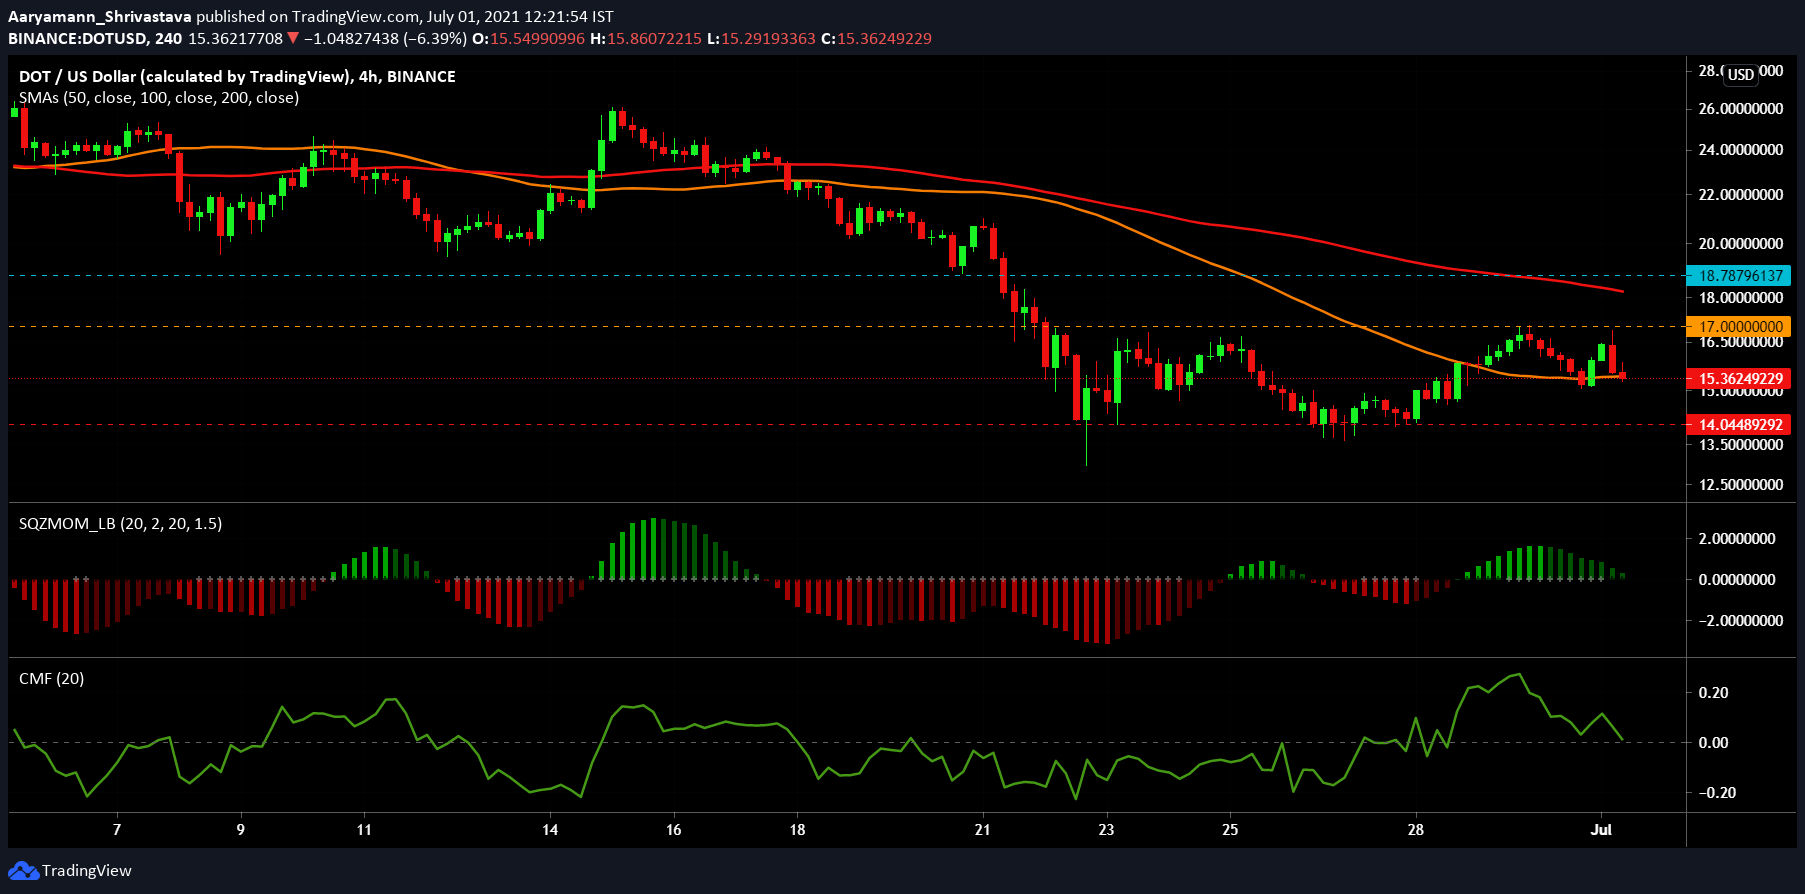
Source: DOT/USD – TradingView
Despite its volatility, Polkadot did not breach its 12-day long resistance and support levels. While the altcoin has been testing the $17 and $14 levels, it did not manage to break past either of them.
The Simple Moving Averages lines were in different positions. While the 50 SMA (orange) line was in support earlier, it could be seen switching to resistance. The 100 SMA (red) line was already bearish.
The Squeeze Momentum Indicator highlighted bullish pressure receding on the 4-hour chart due to the appearance of dark green bars. The indicator was in an active squeeze (black dots), at the time of writing. Capital outflows were starting to become dominant, according to the Chaikin Money Flow, with the indicator likely to head below zero soon.
DOT can fall even more, but it should consolidate within the aforementioned levels.
Uniswap [UNI]
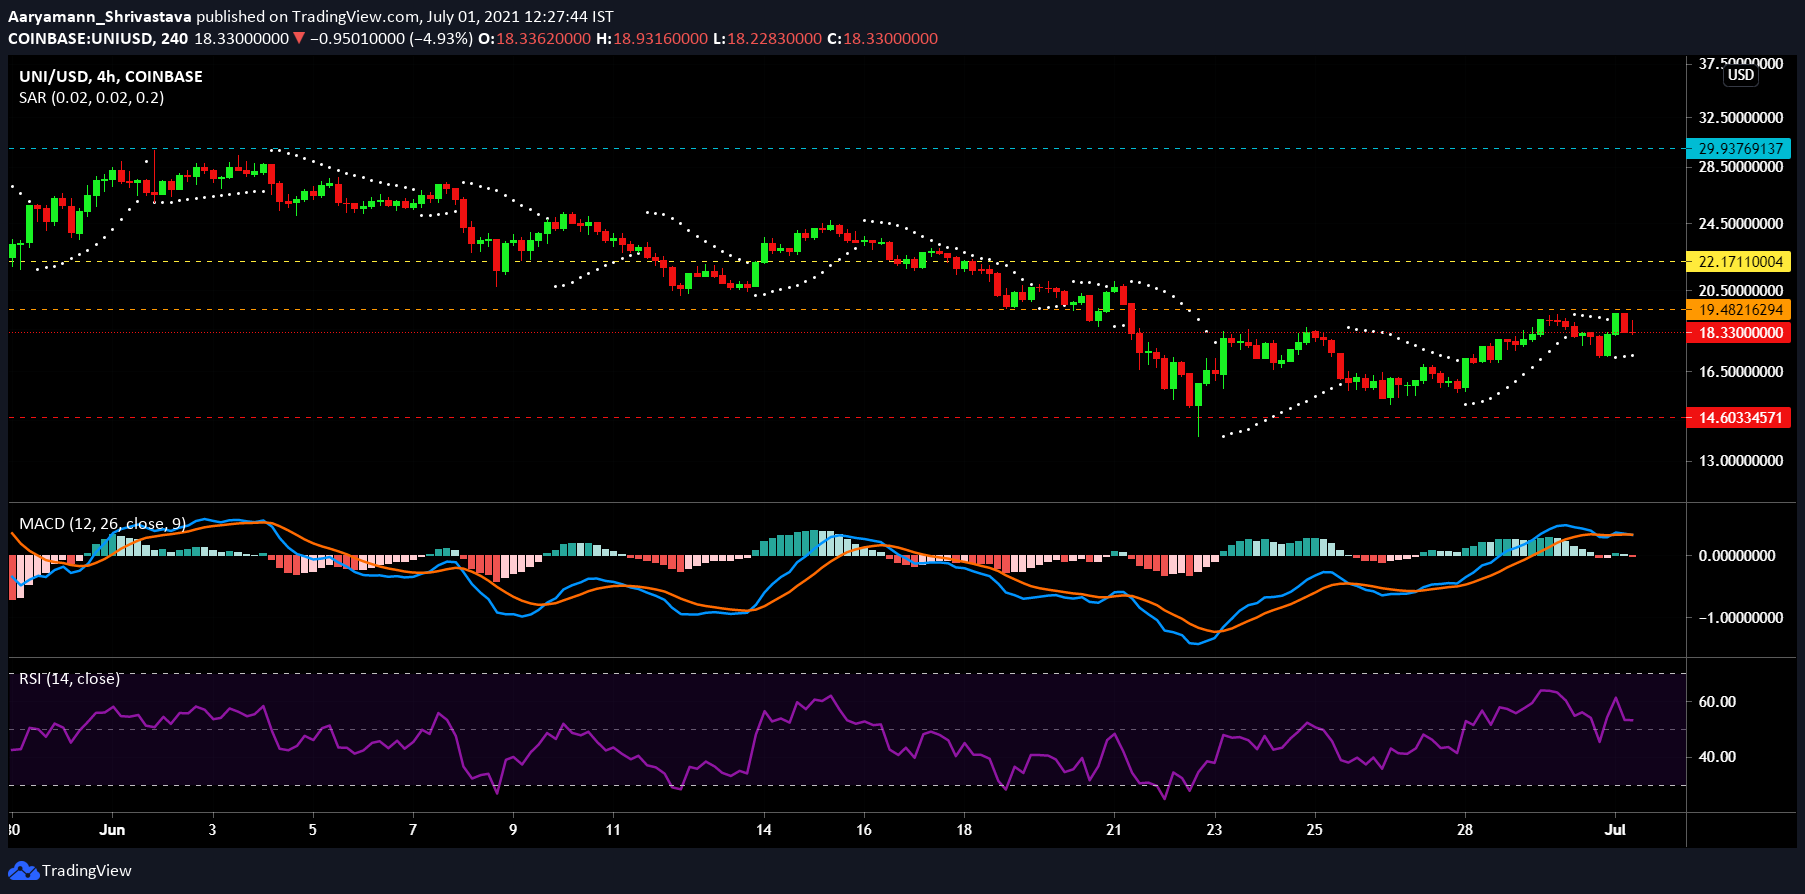
Source: UNI/USD – TradingView
Over the last 2 weeks, UNI flipped two of its support levels into resistance and continued to test its critical $14 support. Moving up, it also tested the $19 resistance, but failed to breach it. Thus, UNI was continuing to trade under it at $18, as of press time.
The Parabolic SAR registered an active uptrend as the white dotted line appeared below the candlesticks. The Relative Strength Index dropped from 64 to 52 and remained steady in the bullish-neutral territory.
The MACD gave off mixed signals as the fast-moving blue line was aligned with the red signal line. The histogram was red, at the time of writing, but did not clearly point to a bearish crossover.
If the trend remains strong and the market supports it, UNI could potentially go past its strong resistance level and move upwards.