Dogecoin Price Analysis: 12 June

Disclaimer: The findings of the following analysis are the sole opinions of the writer and should not be taken as investment advice
Dogecoin captured most of crypto-spotlight, especially during its bull run from mid-April to early-May. A good chunk of its year-to-date gains of 5,400% came during this period as a number of external factors contributed to the ‘meme coin’s’ success. Positioning itself among the market’s top-10 alts over the last few months, Dogecoin held the 6th spot on CoinMarketCap with a market cap of nearly $40 billion, at press time.
Dogecoin daily chart
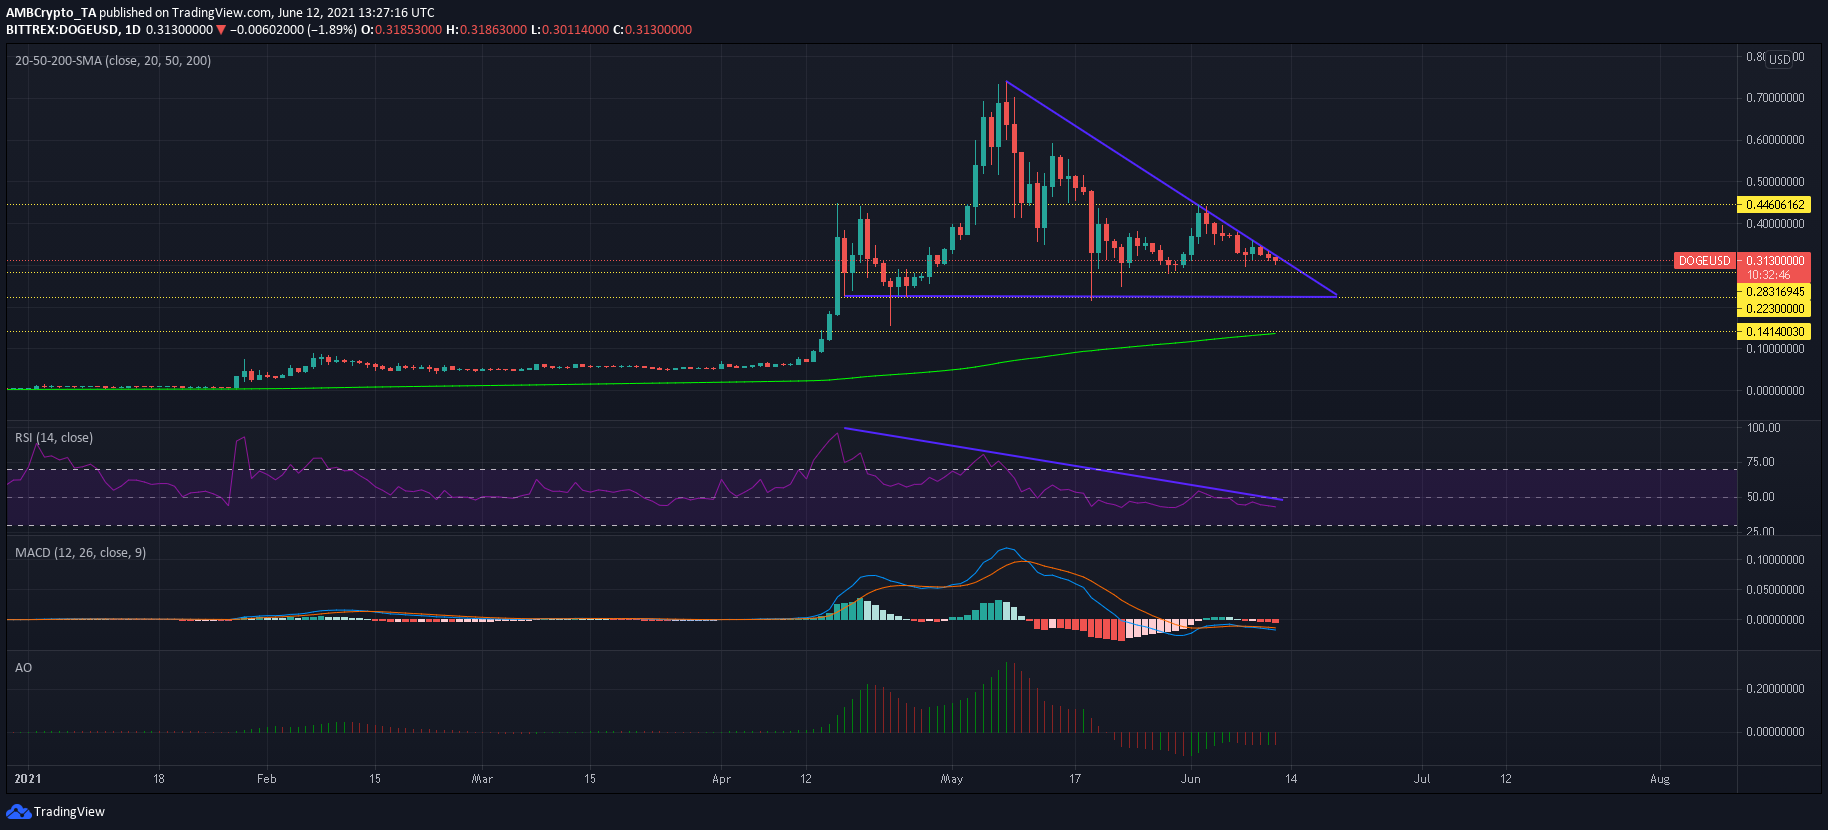
While Dogecoin’s stats were impressive, to say the least, its movement was rather bleak since snapping record levels at $0.73 in early May. Since then, DOGE has failed to maintain higher levels and even slipped below the strong defensive line of $0.44. The market bulls did attempt a recovery above the aforementioned point in early June, but further upside was denied by sellers.
The downtrend from its May peak led to the formation of a descending triangle and the bottom trendline represented a support zone between $0.25-$0.223. Further southbound action and breakdown from the lower trendline could open the floodgates for another 37% decline towards the $0.141 support. To invalidate the pattern, DOGE must defend $0.25-$0.223 from a breakdown and target a hike above the $0.28-resistance.
Reasoning
The Relative Strength Index has been on a steady decline since DOGE touched its April high of $0.44. The downtrend would eventually lead towards the oversold zone where a bounceback can be expected. Until then, DOGE would likely be under the pump.
Moreover, the market was yet to show signs of a clear recovery since the 19th May crash. While the MACD’s histogram showed a decline in bearish momentum, a crossover below the Signal line tilted the market back towards the sellers. Even the Awesome Oscillator noted choppy movement over the past week.
Since the RSI pointed towards some more downside and MACD and Awesome Oscillator took a bearish-neutral approach, Dogecoin could look at further losses in the coming days. Losses would be amplified in case of a break below the $0.25-0.223-support – A development that could drag the cryptocurrency towards the support area at $0.141. This region was bolstered by the 200-SMA (green) and would provide an extra layer of support.
Conclusion
Since Dogecoin was trading within a descending triangle, its price remained exposed to an additional sell-off. A move below the lower trendline could trigger a 37% drop towards $0.141 and 200-SMA (green). While DOGE’s technicals did not indicate a breakdown just yet, several warning signs were present in the market and traders must be cautious of a decline over the coming weeks.


![Dogecoin [DOGE]](https://ambcrypto.com/wp-content/uploads/2026/07/Gladys-52-1-e1782893242505.jpg)