Dogecoin traders, look out for Bitcoin’s effect on the memecoin because…
An important break in market structure could bring good news.

- Market structure of Dogecoin was bullish on the daily chart at press time
- Spot CVD trend seemed to worry short-term bulls
Dogecoin [DOGE], at press time, was beginning to bounce from the $0.1225 support level after facing losses this week. This, after Bitcoin’s [BTC] volatility, with the memecoin mirroring the trend of the king coin.
In fact, a recent report noted that DOGE may be poised for a 44% rally after the breakout past a wedge pattern. This prediction might seem ambitious as BTC approaches the $69k resistance zone, but DOGE has done crazy things in the past.
Momentum and price action in favor of DOGE bulls
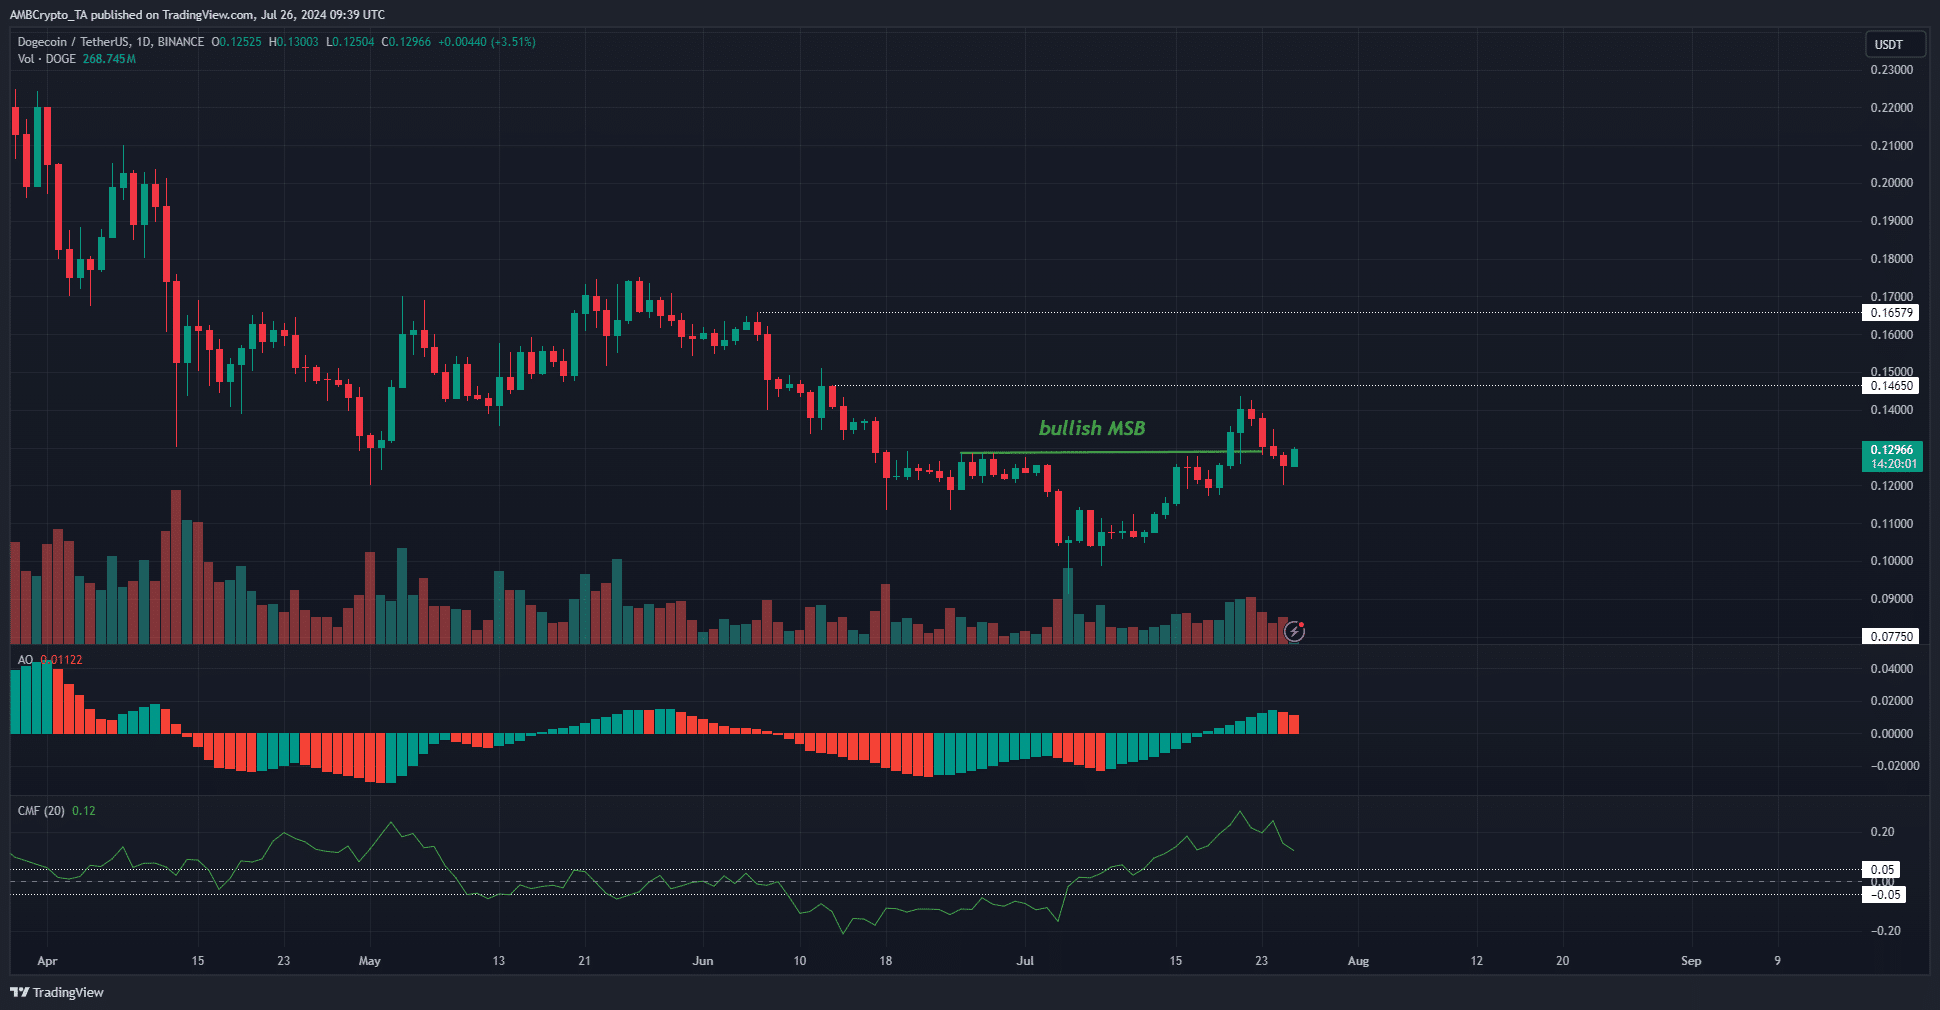
The technical indicators were firmly bullish. The Awesome Oscillator was above neutral zero, showing bullish momentum was dominant. Its red bars over the past two days reflected the pullback from $0.14.
The CMF was at +0.12 to signal sizeable capital inflows to Dogecoin markets. This was a sign of sustained buying pressure and signaled prices could continue to trend higher.
The bullish market structure break highlighted in the chart above revealed that swing traders can be bullishly biased. The $0.145 and the $0.165 levels are the next resistances to watch out for.
Funding rate back in positive territory
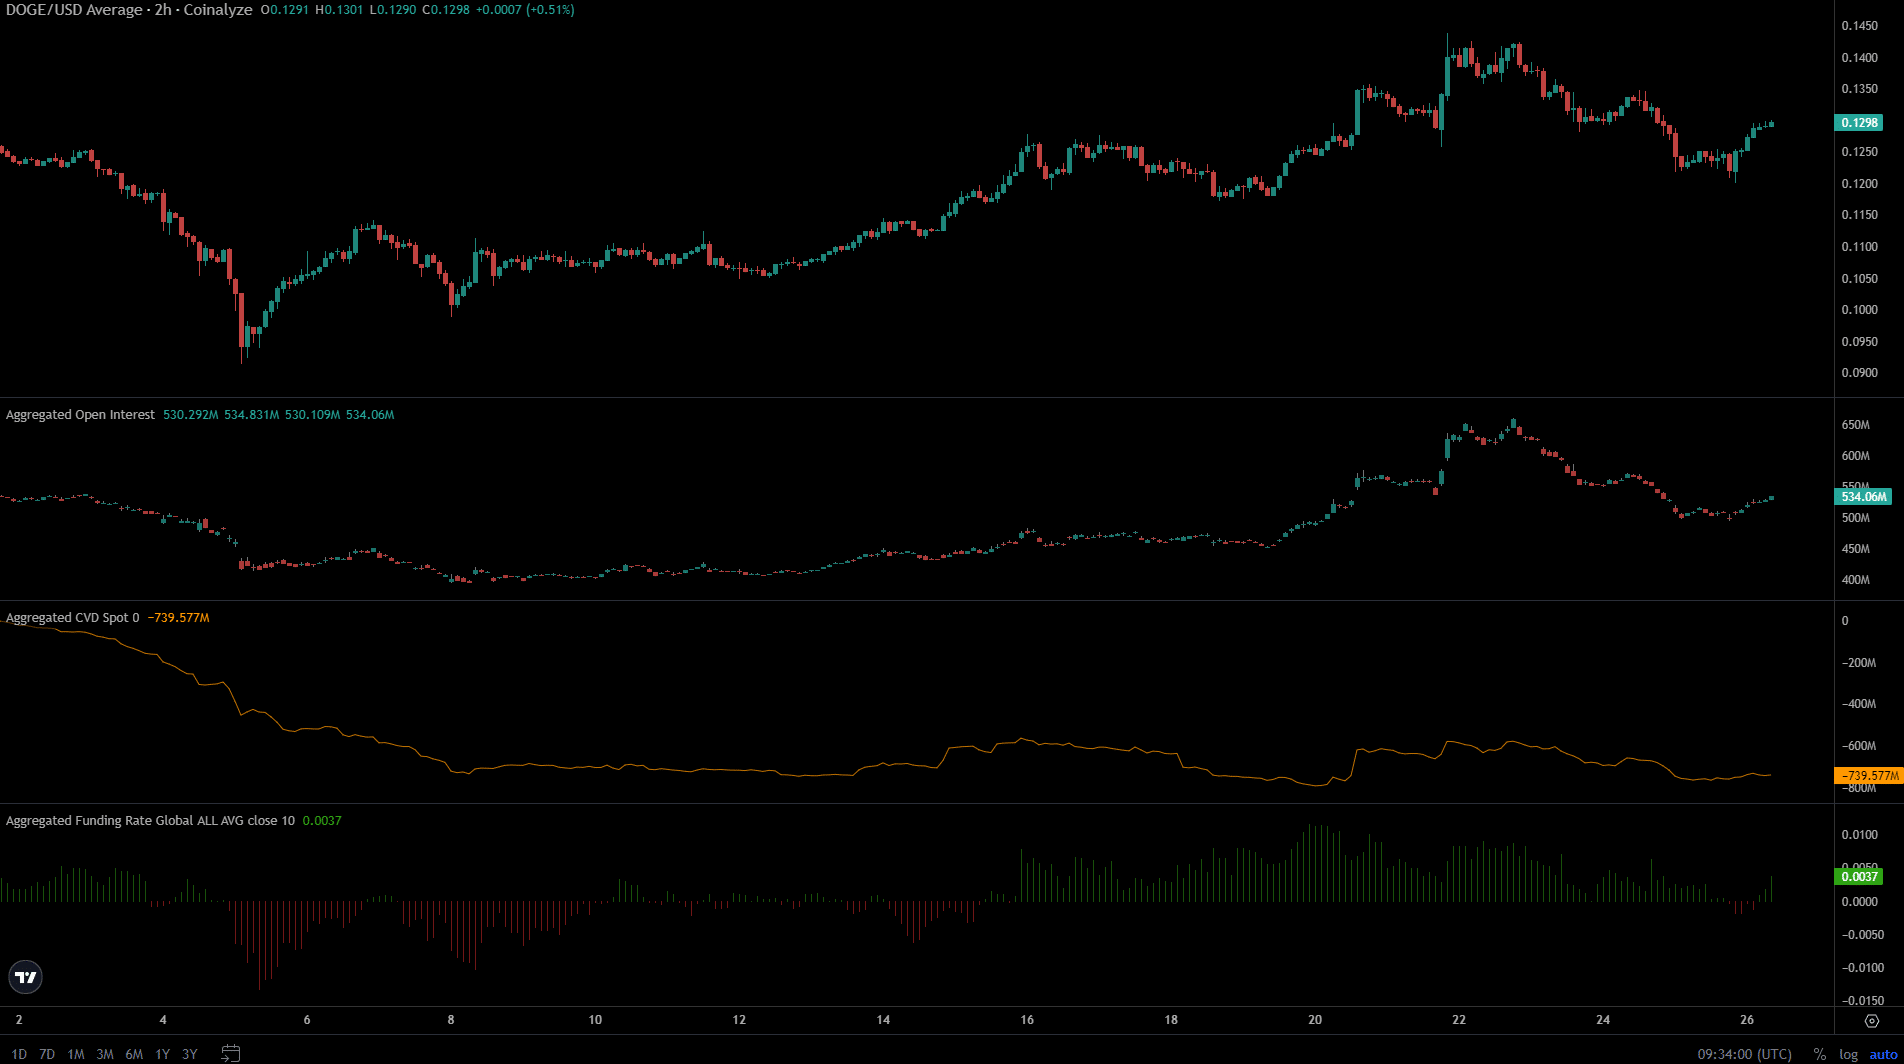
The recent price drop from $0.145 saw the funding rate dip into negative territory. This showed that short positions were paid funding by the longs, a sign of increasing short positions. The Open Interest also fell over the past three days.
Is your portfolio green? Check the Dogecoin Profit Calculator
At press time, this had begun to change though. The OI was climbing once more, as was the funding rate. The sentiment seemed to slowly turn bullish too, but the spot CVD was uninspiring. It was unable to jump higher with the price bounce, signaling a lack of buying volume.
Disclaimer: The information presented does not constitute financial, investment, trading, or other types of advice and is solely the writer’s opinion.


