Dogecoin was perched atop $0.08 and selling pressure could mount at…

Disclaimer: The findings of the following analysis are the sole opinions of the writer and should not be considered investment advice.
Dogecoin [DOGE] had a bearish outlook on the higher timeframe charts as it continued to form lower highs on the chart. The $0.095 and $0.111 are the levels of resistance to watch out for. Dogecoin was trading at $0.08 at the time of writing, but it had strong selling pressure over the past couple of months.
A Bitcoin surge might see a Dogecoin rally as well, but this might not reverse the downtrend that DOGE has been on since last November.
DOGE- 12 Hour Chart
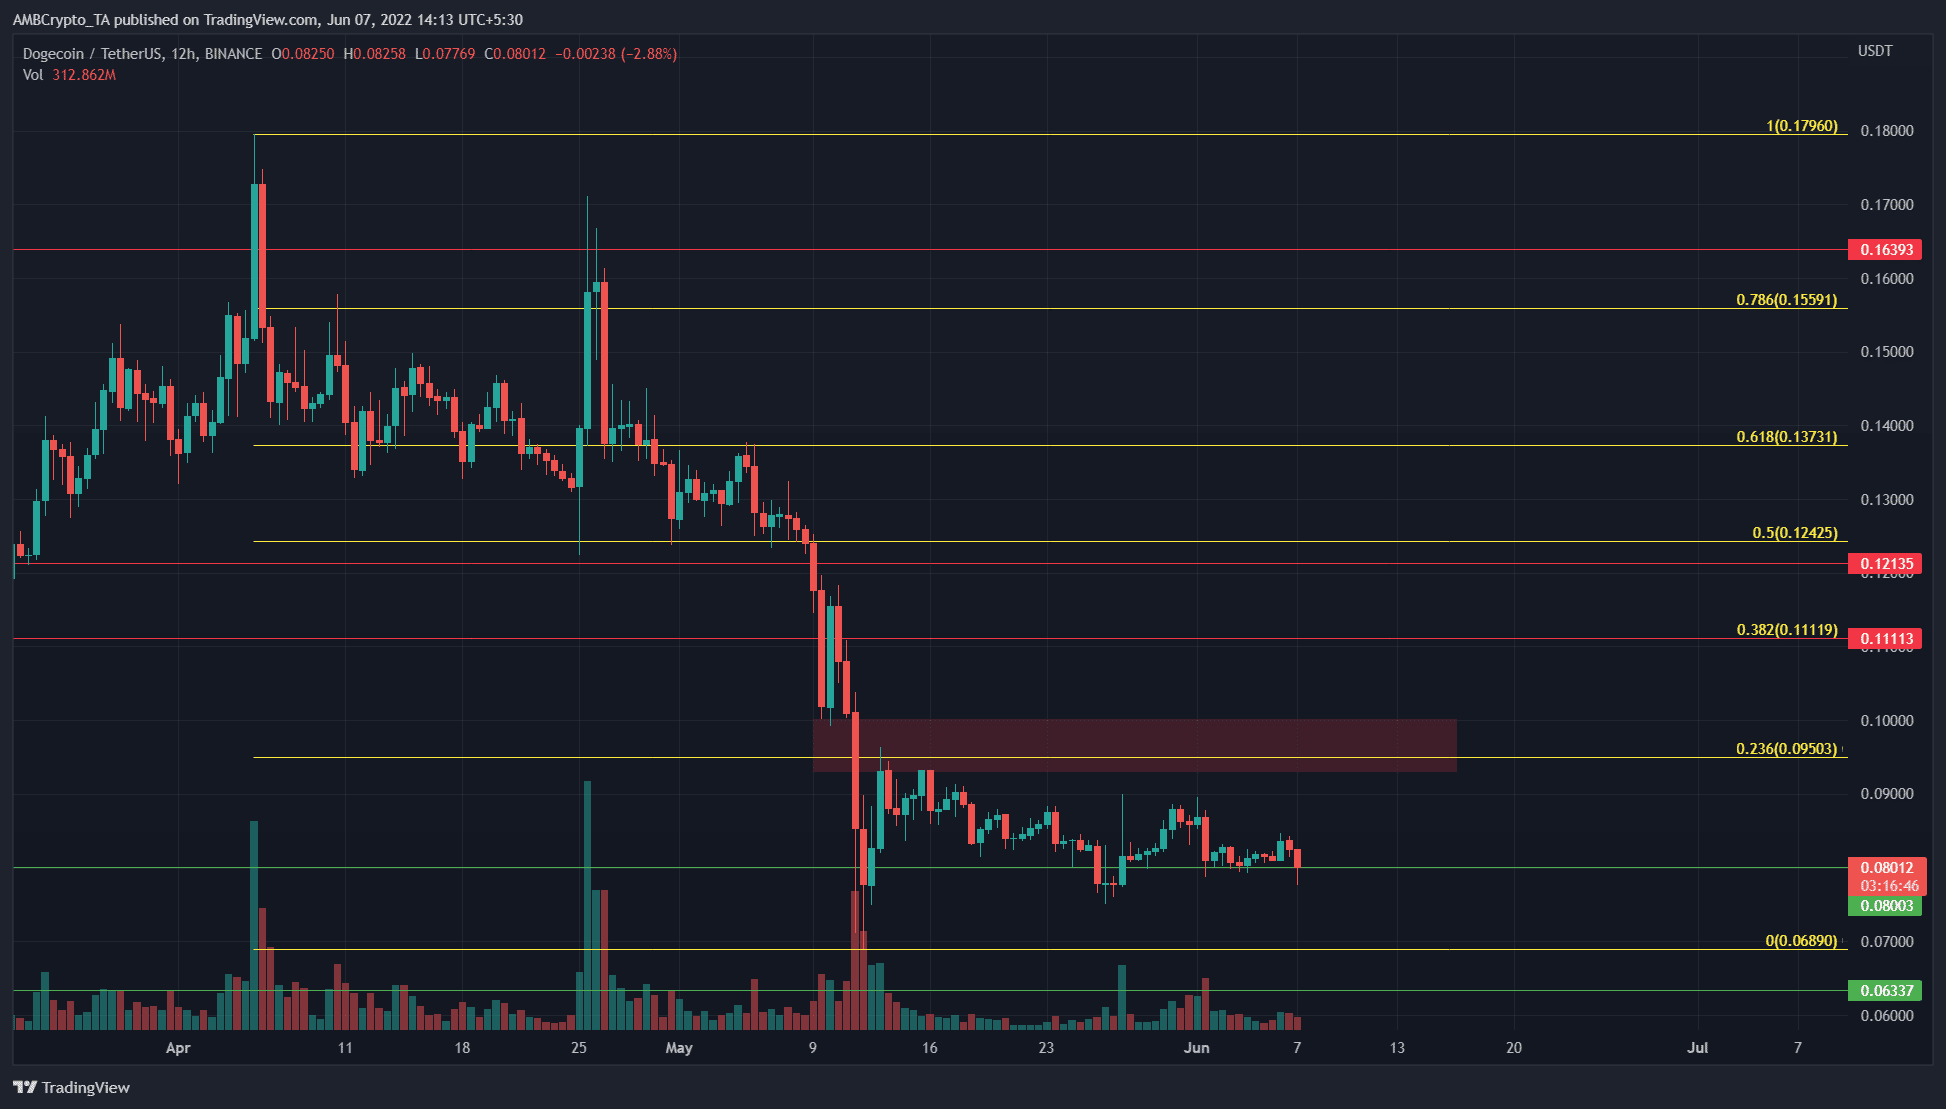
The market structure of DOGE has been strongly bearish since April. There have been some wicked bull traps since April began, such as the one on 25 April where the price rose from $0.124 to $0.164, before reversing just 36 hours later.
In late May as well, the price surged from $0.077 to $0.09 before falling back to the $0.08 level a few days later.
A set of Fibonacci retracement levels (yellow) was drawn from the $0.179 swing high to the $0.0689 swing low. The $0.095 level, which was the 23.6% retracement level of this move, was flipped to resistance in mid-May. Beneath $0.08, the next support level lies at $0.064.
Rationale
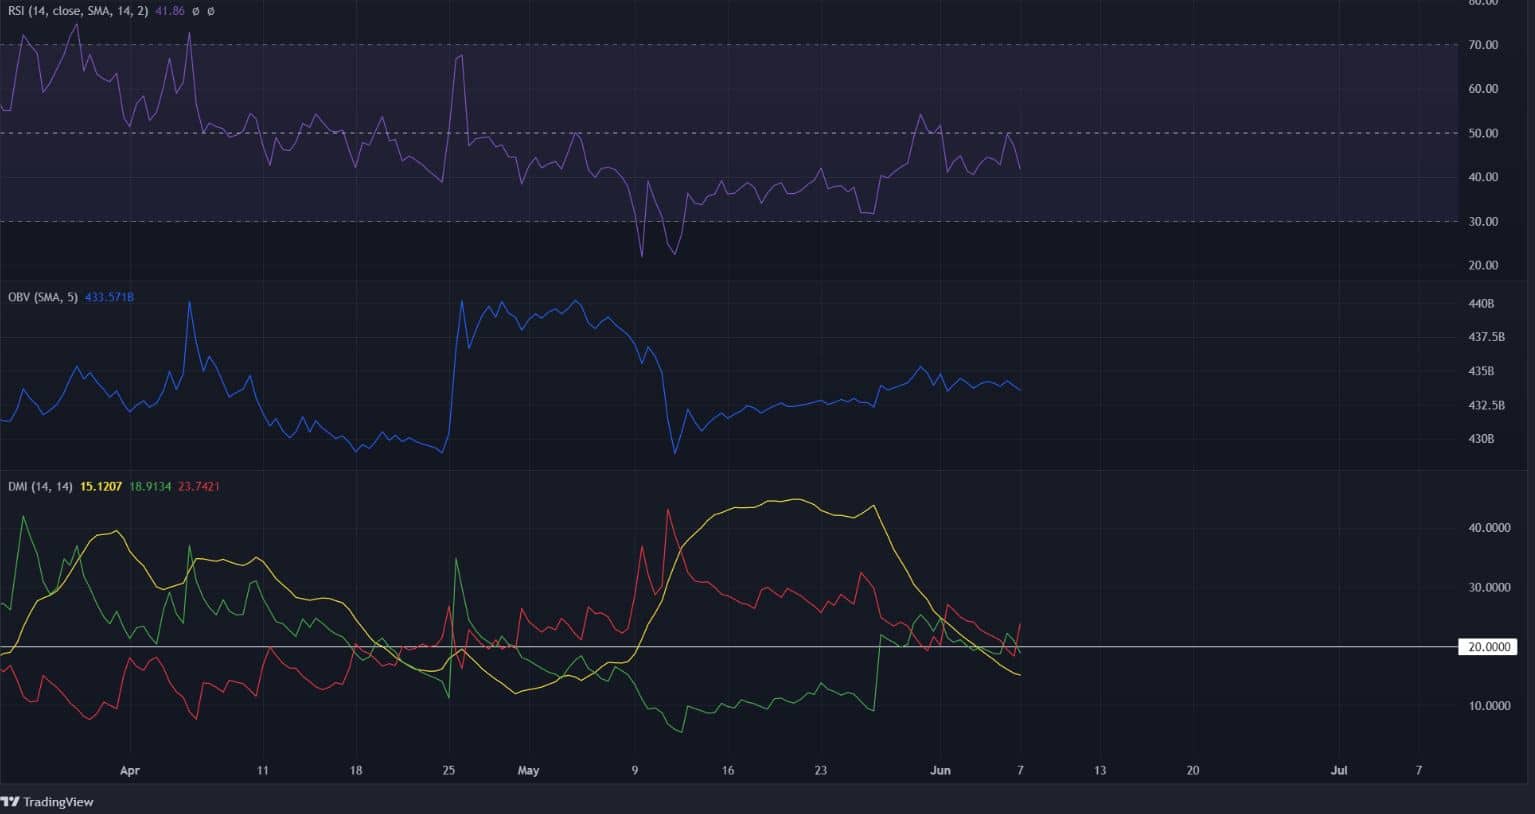
The H12 RSI chart showed a strong downtrend for DOGE in May, as it has stayed below the neutral 50 line. At the time of writing, the 41 value showed weak bearish momentum.
The OBV has formed higher lows after the 12 May crash, which meant buying volume has outweighed selling volume, even as the price made lower lows. While this divergence generally indicates a rally could be likely, the market structure is bearish.
At the time of writing, the DMI showed no strong trend in motion. For the majority of May, both the -DI (red) and the ADX (yellow) were above 20 to show a strong downtrend.
Conclusion
Dogecoin does not offer a buying opportunity, especially not to the risk-averse investor. A retest of the $0.09 or the $0.0905 level, if it presents itself in the next few weeks, would be for selling.
A session close above $0.095, and a retest as support from above, could be indicative of a move toward $0.111.


