Dogecoin, XRP, Terra Price Analysis: 07 May

Dogecoin showed bearish conditions in the market prior to Elon Musk’s Saturday Night Live appearance. XRP needed to defend $1.53 support from incoming selling pressure. Lastly, Terra traded within a descending triangle and the threat of a breakdown loomed large.
Dogecoin [DOGE]

Source: DOGE/USD, TradingView
Leader of the ‘memecoin rally‘, Dogecoin has seen gains of over 100% during the last seven days. Not only were these the highest figures among the top 10 cryptocurrencies, but also well above Bitcoin Cash’s gains of 50% – the second-highest gainer of the week. Buying activity in the DOGE market even pushed its market cap north of $80 Billion as it dethroned XRP to become the 4th-largest coin by market cap.
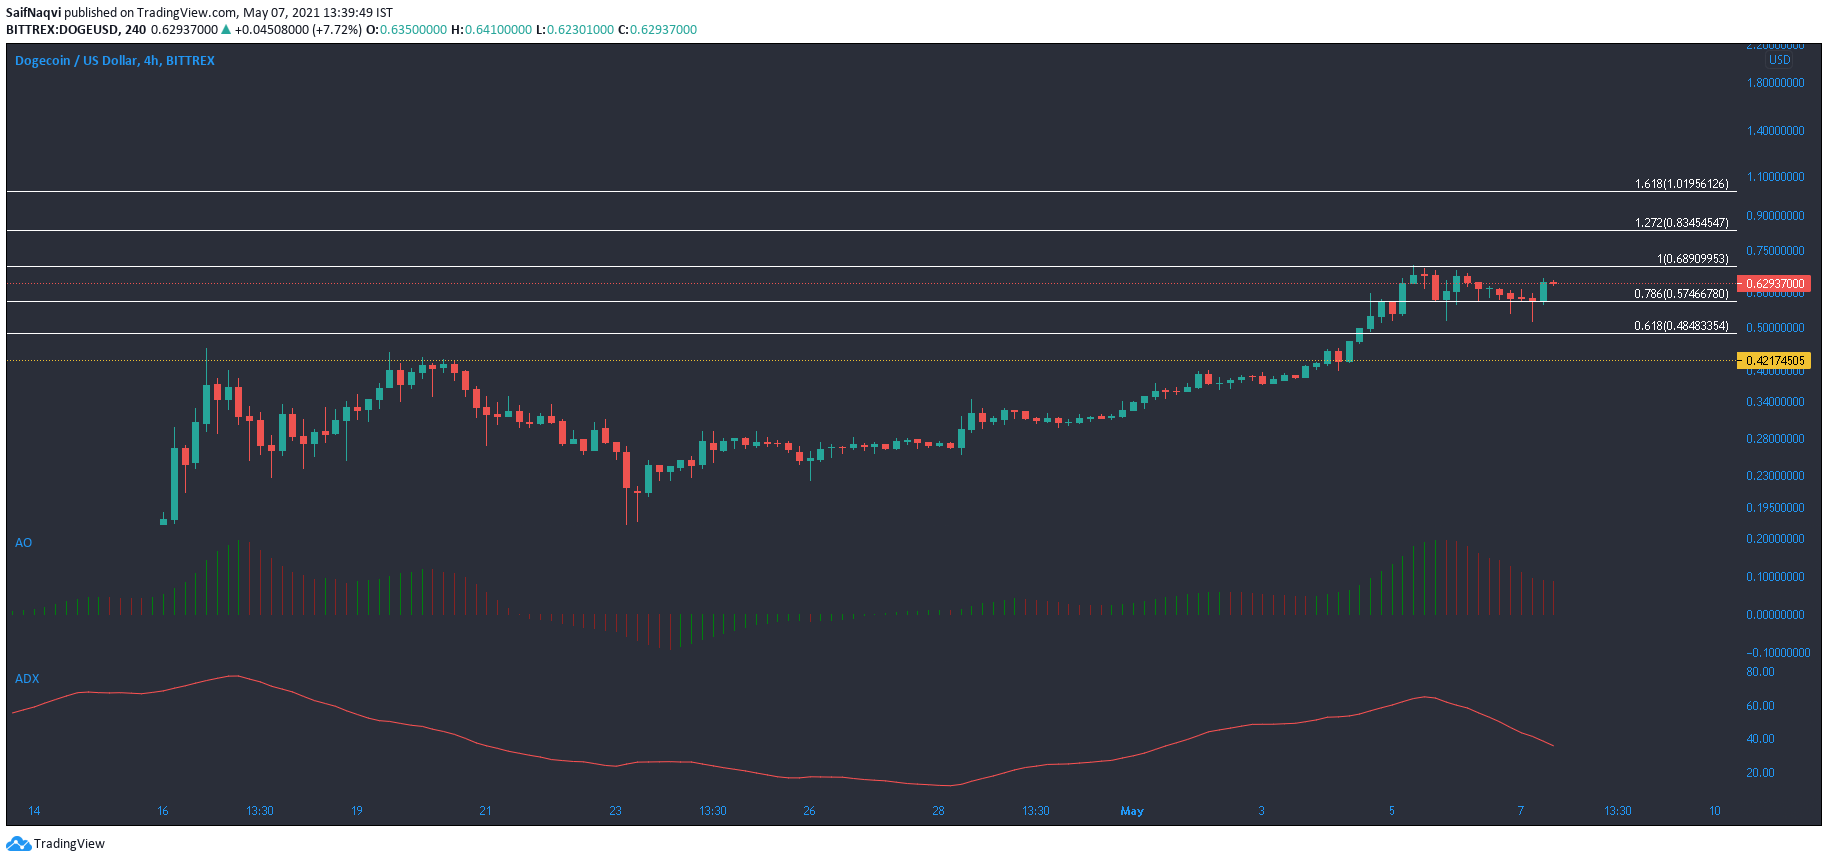
Prior to Elon Musk’s Saturday Night Live Appearance due on May 8, Dogecoin surprisingly noted some bearish pressure in the market. Awesome Oscillator noted a series of red bars as momentum shifted to the selling side, while the 24-hour trading volumes contracted by 33% and fell to $22 Billion.
Some support lay at 78.6% Fibonacci level at $0.574 and the bulls would look to defend this from a breakdown. In the case of a northbound push, a few targets lay at 127.2% ($0.834) and 161.8% ($1.01) Fibonacci levels. Even though ADX fell steadily over the past few sessions, its reading was well above 25 and a strong trend still presided in the market.
XRP

Source: XRP/USD, TradingView
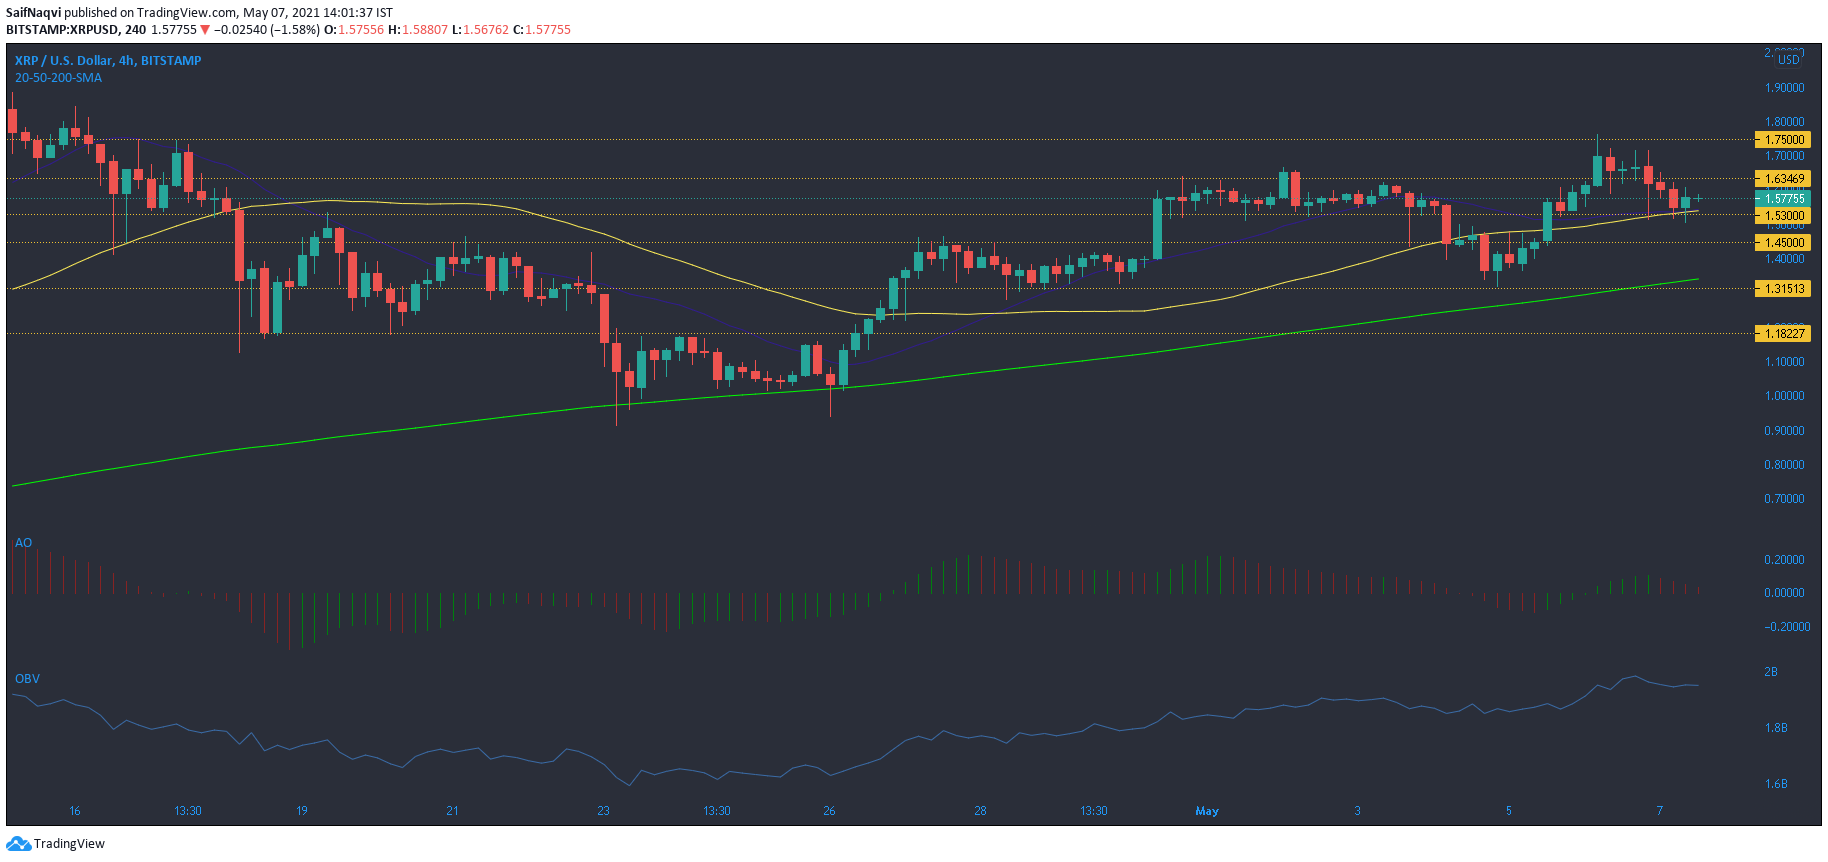
XRP saw buying at $1.31 and while this did push it up the charts, buyers were unable to topple $1.75 resistance. This led to some bearish pressure and while the 20-SMA (blue) and 50-SMA (yellow) offered some support, there was a chance of a further breakdown. Awesome Oscillator noted the said bearish pressure and a move below the half-line could indeed lead to an unfavorable outcome. Trading volumes across exchanges showed muted activity and a price hike was off the table at least over the coming sessions. Instead, focus would be on different support lines.
A southbound move from $1.53 support would see XRP head towards another defensive line at $1.45. Another strong region of support resided at $1.31 and around the 200-SMA (green). OBV has been on a steady uptrend since late April and buying pressure would likely counter any move below the long-term moving average.
Terra [LUNA]

Source: LUNA/USD, TradingView
Resistance at $19.5 continued to play a major role in halting Terra’s recovery towards late-March levels. Sellers have denied a breakout above this point on several occasions. In fact, a look at the 4-hour timeframe painted an even grimmer picture. Lower highs and steady lows led to the formation of a descending triangle. The bottom trendline, which coincided with the 200-SMA, was a crucial region for the bulls. A breakdown from this line could drag LUNA all the way towards $12.2 before the buyers step in once again.
Sharp downwards movement in OBV highlighted the prevalent selling pressure in the market. MACD was also below the half-line and a bullish crossover did not seem likely.


