Filecoin, Bitcoin Cash, Theta Price Analysis: 07 May

Filecoin traded below its 200-SMA and the bulls faced an uphill task to topple $165-resistance. Bitcoin Cash projected pullbacks at a few support levels before the next leg upwards. Finally, Theta broke above the $12-mark and volumes must be observed for sharper gains in the coming sessions.
Filecoin [FIL]
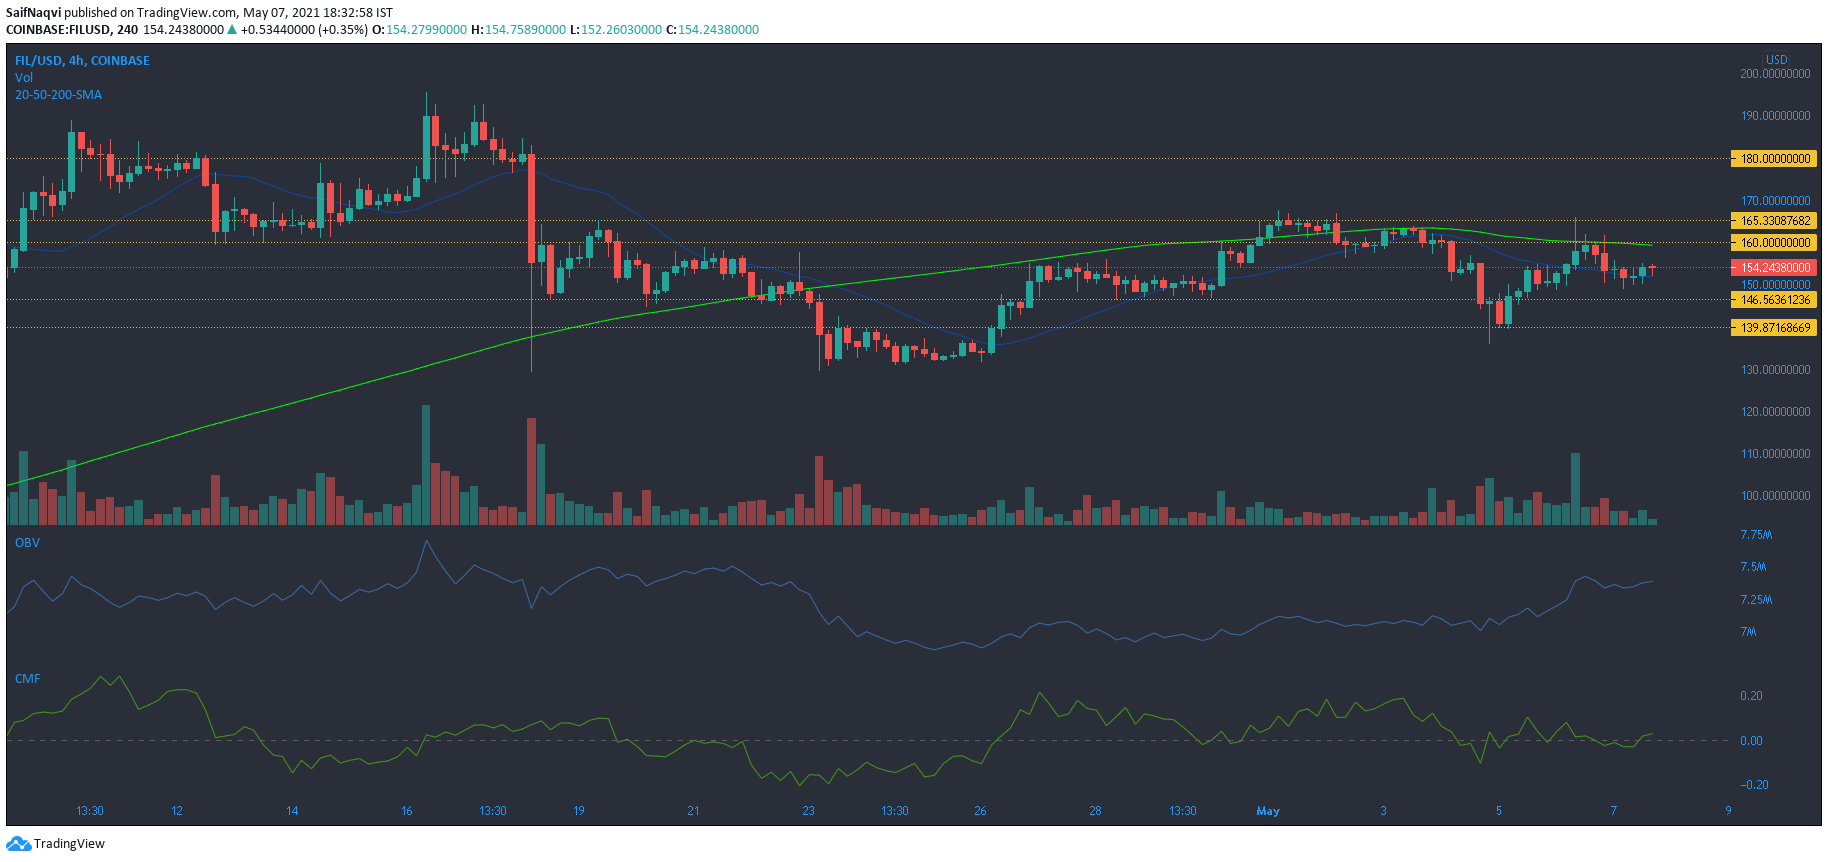
While Filecoin has been in a recovery mode, $165.3-resistance has capped gains in the market. A look at the volumes showed that trading activity since late April was quite distant from levels seen in March and early April. Even OBV was yet to fully recover despite trending slightly over the past few sessions. On the 4-hour timeframe, candlesticks were below their long-term moving average after the 20-SMA (blue) fell below the 200-SMA (green).
To accelerate FIL’s comeback, the bulls first needed to overturn $165-resistance. The next few targets lay at $180 and $194. Meanwhile, the CMF moved above the half-line as capital inflows outmatched outflows. However, stronger cues were needed to topple the aforementioned resistance levels.
Bitcoin Cash [BCH]
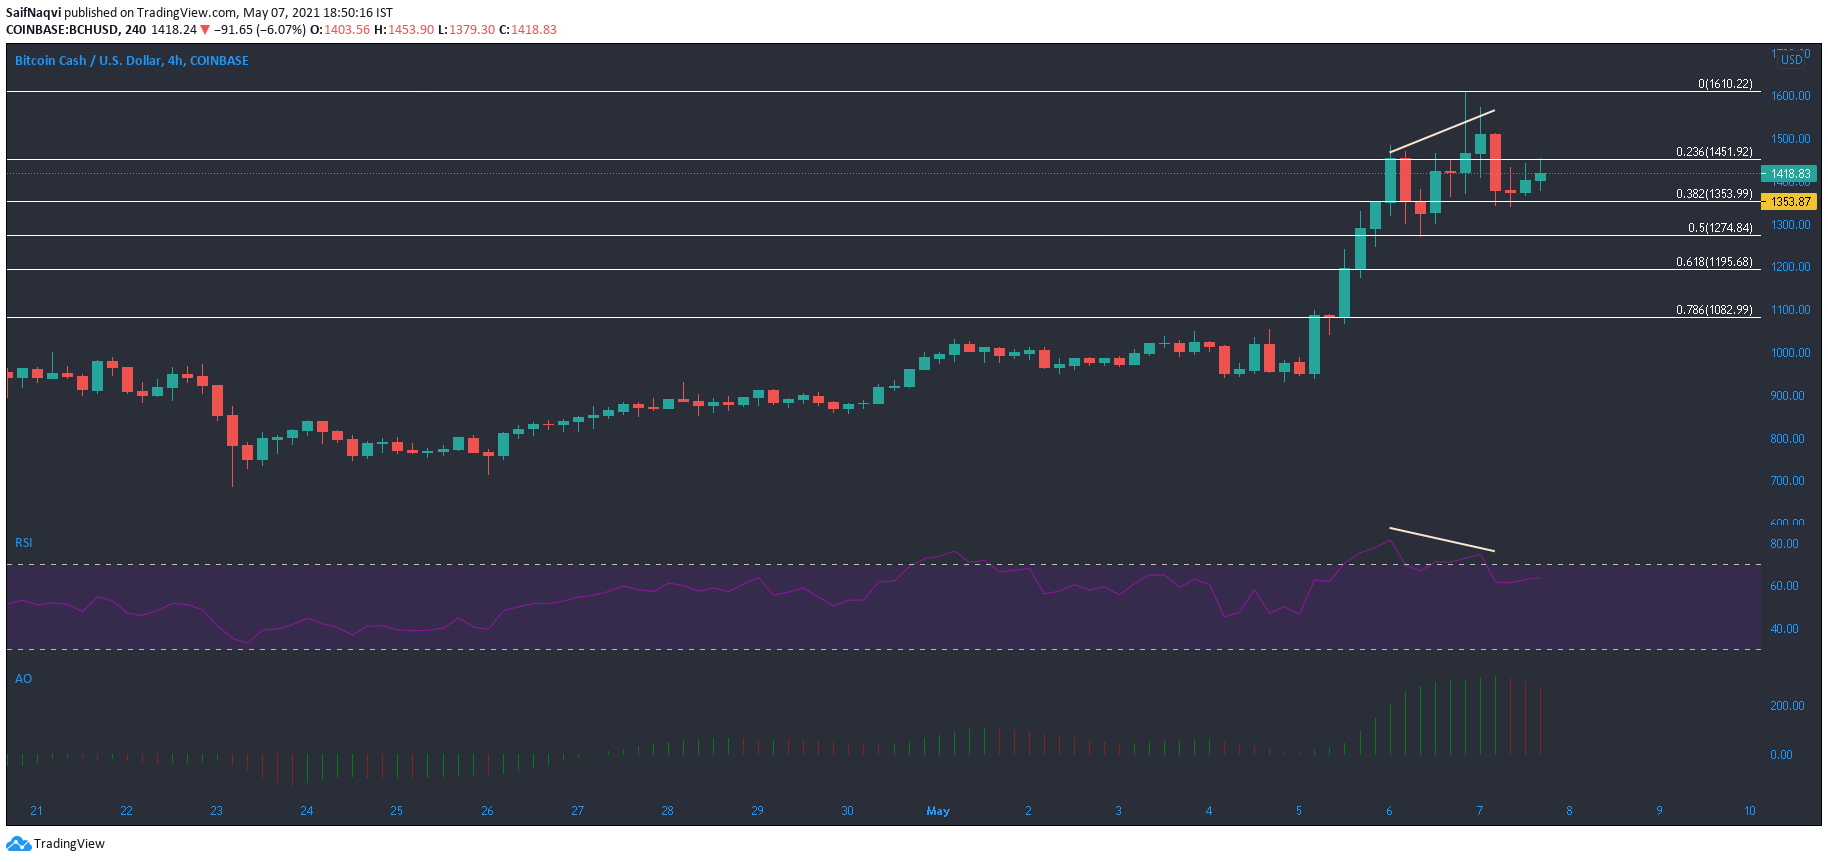
Bitcoin Cash saw increased buying activity once the price rose above $1,200 upper ceiling. This led to a newer local top and a single candlewick even rose as high as $1,600. At the time of writing, trading volumes were on a decline and suggested that BCH’s uptrend might cool off over before the next upswing. A bearish divergence was spotted on RSI as the price dropped towards $1,353-support. This support could be in focus moving forward as well.
Fibonacci tool highlighted some additional support levels as well. The 50% level lay around $1,274, while the 61.8% rested at $1,200. Meanwhile, Awesome Oscillator noted some selling pressure in the market after noting a series of red bars.
Theta [THETA]
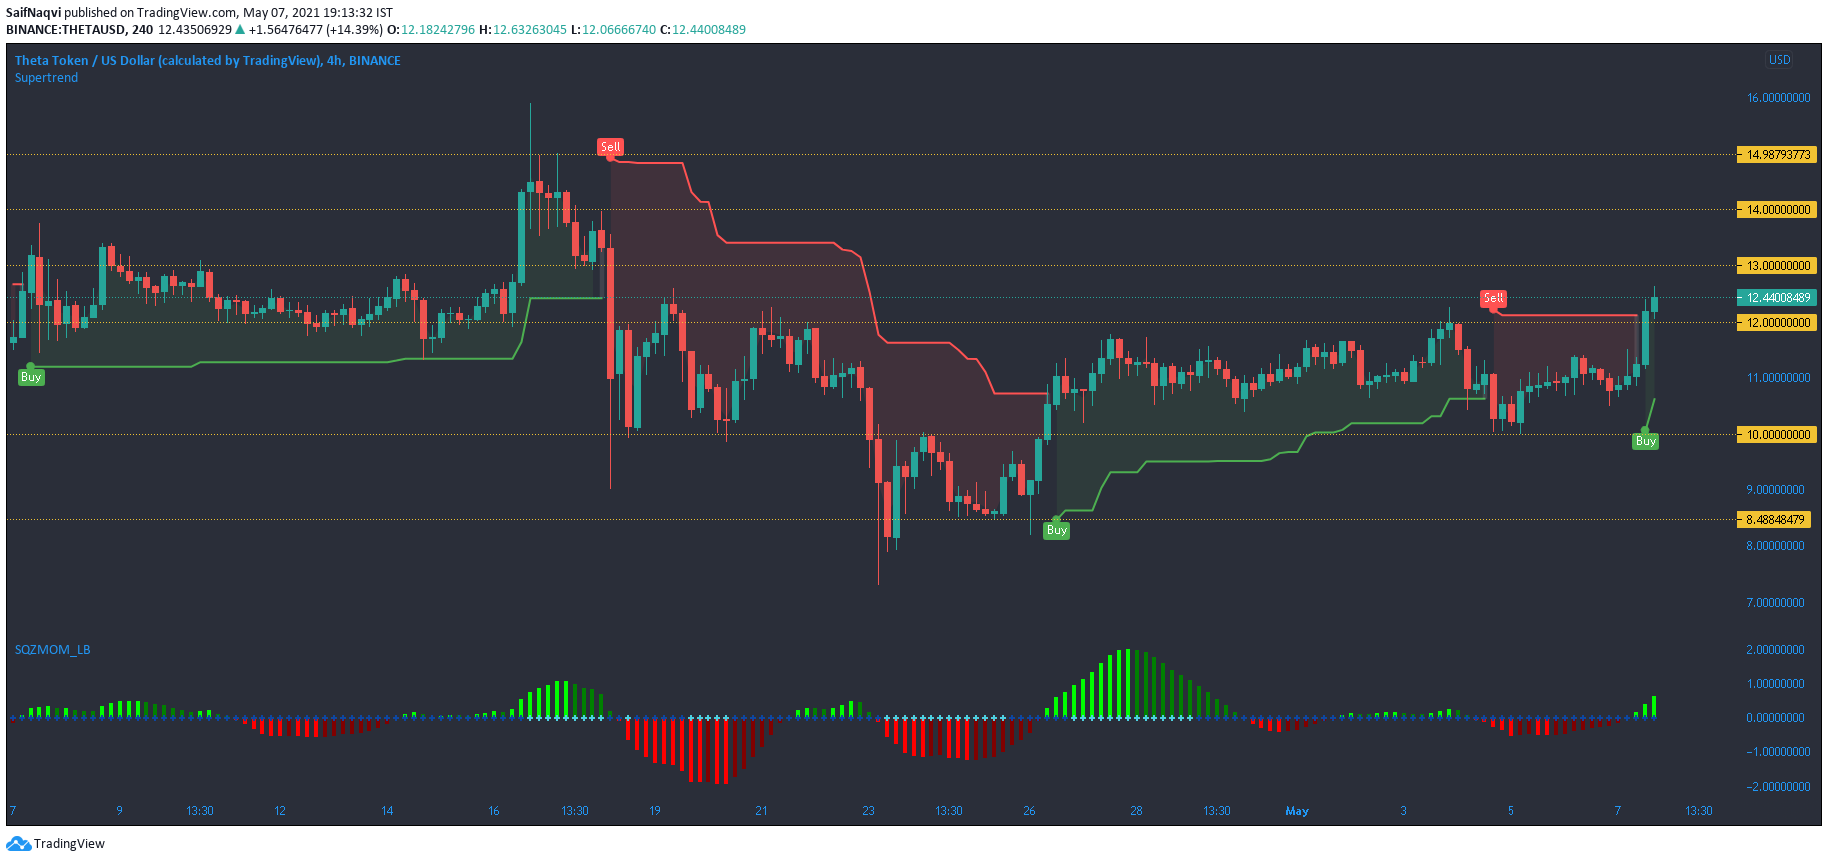
At the time of writing, Theta rose above $12-resistance on relatively higher volumes and this could spur some additional buying. Supertrend Indicator flashed a buy signal with a stop loss placed around $10.6. On the downside, volatility was not there yet to support a price surge.
Squeeze Momentum Indicator’s (SMI) dark blue dots suggested that the market was in a squeeze and even though momentum was on the buying side, gains could be limited in the market. The 24-hour trading volumes should be monitored over the coming sessions for a sharper price swing. If volumes do pick up, the next targets for the bulls lay at $13 and $14. In such a case, SMI would likely register light blue dots- an indication of a ‘squeeze release’.


