DOT is at a major fork in the price chart — here’s how traders can navigate it

Disclaimer: The information presented does not constitute financial, investment, trading, or other types of advice and is solely the writer’s opinion.
- Polkadot bulls could wait for a retracement or a breakout to enter long positions
- The liquidation levels plotted significant levels where a short-term reversal could occur
Polkadot [DOT] stamped its presence in terms of development activity by securing the second position in terms of GitHub repositories. Yet, despite this activity, the network saw a 9.8% in revenue over the past month.
Read Polkadot’s [DOT] Price Prediction 2023-24
AMBCrypto reported that the price action of Polkadot was flipping bullishly and anticipated a move toward $4. This move occurred as expected. Moreover, DOT pushed well past the $4 psychological level too.
The strength of Bitcoin meant Polkadot traders had many scenarios to prepare for
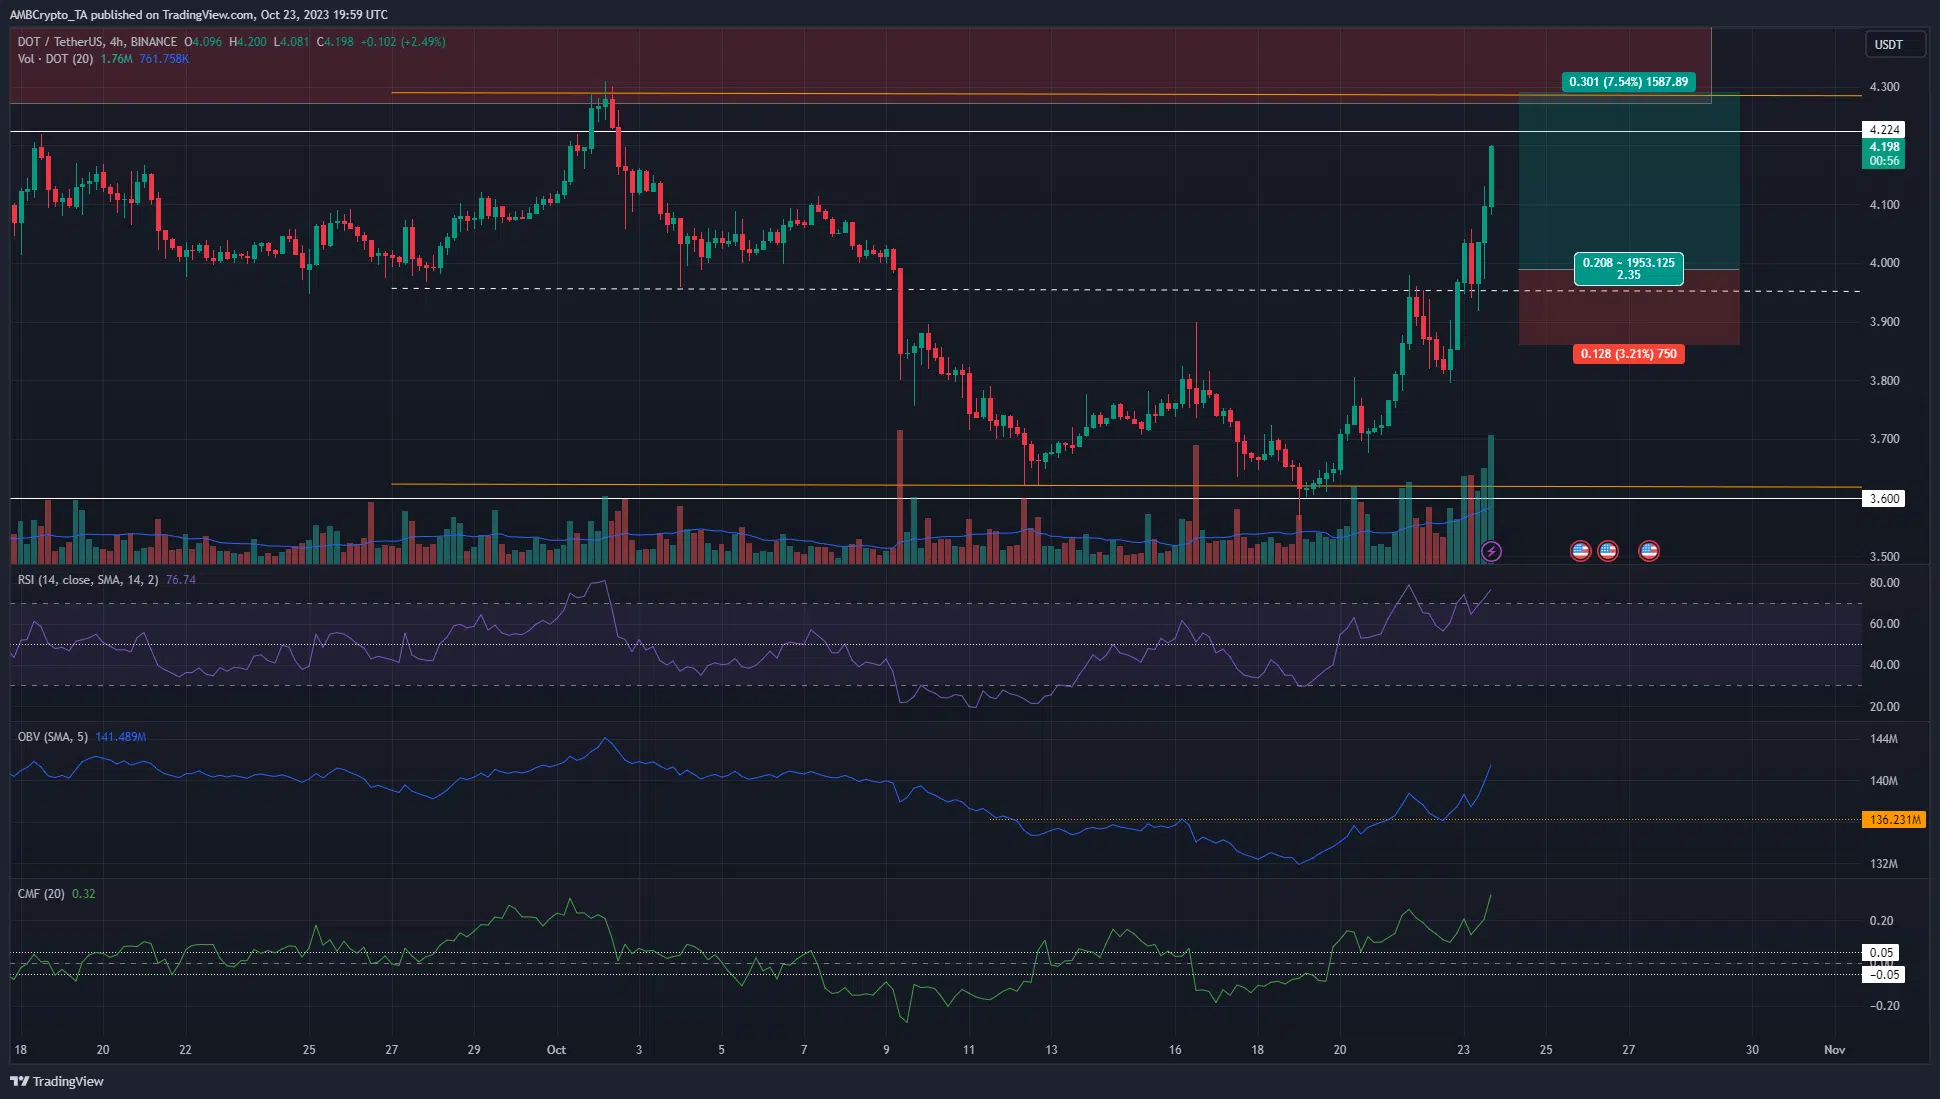
The H4 chart showed a strongly bullish DOT structure. The Relative Strength Index (RSI) also reflected extremely high upward momentum. The On-Balance Volume (OBV) burst past a local resistance and showed a large influx of buying pressure in recent days. The Chaikin Money Flow (CMF) signaled much the same with a reading of +0.32.
Therefore, the indicators suggested that traders can expect more gains to come. But the picture was not yet complete. There was a range formation (orange) that DOT traded within since 2 October. Its high was at $4.29, and the mid-range mark was at $3.95.
Traders could go short with a tight stop-loss near the $4.25 level but this was a risky trade. A more favorable entry could materialize in the coming days after a retracement toward the $4 level.
Liquidation levels hinted that over-leveraged long positions could get hunted

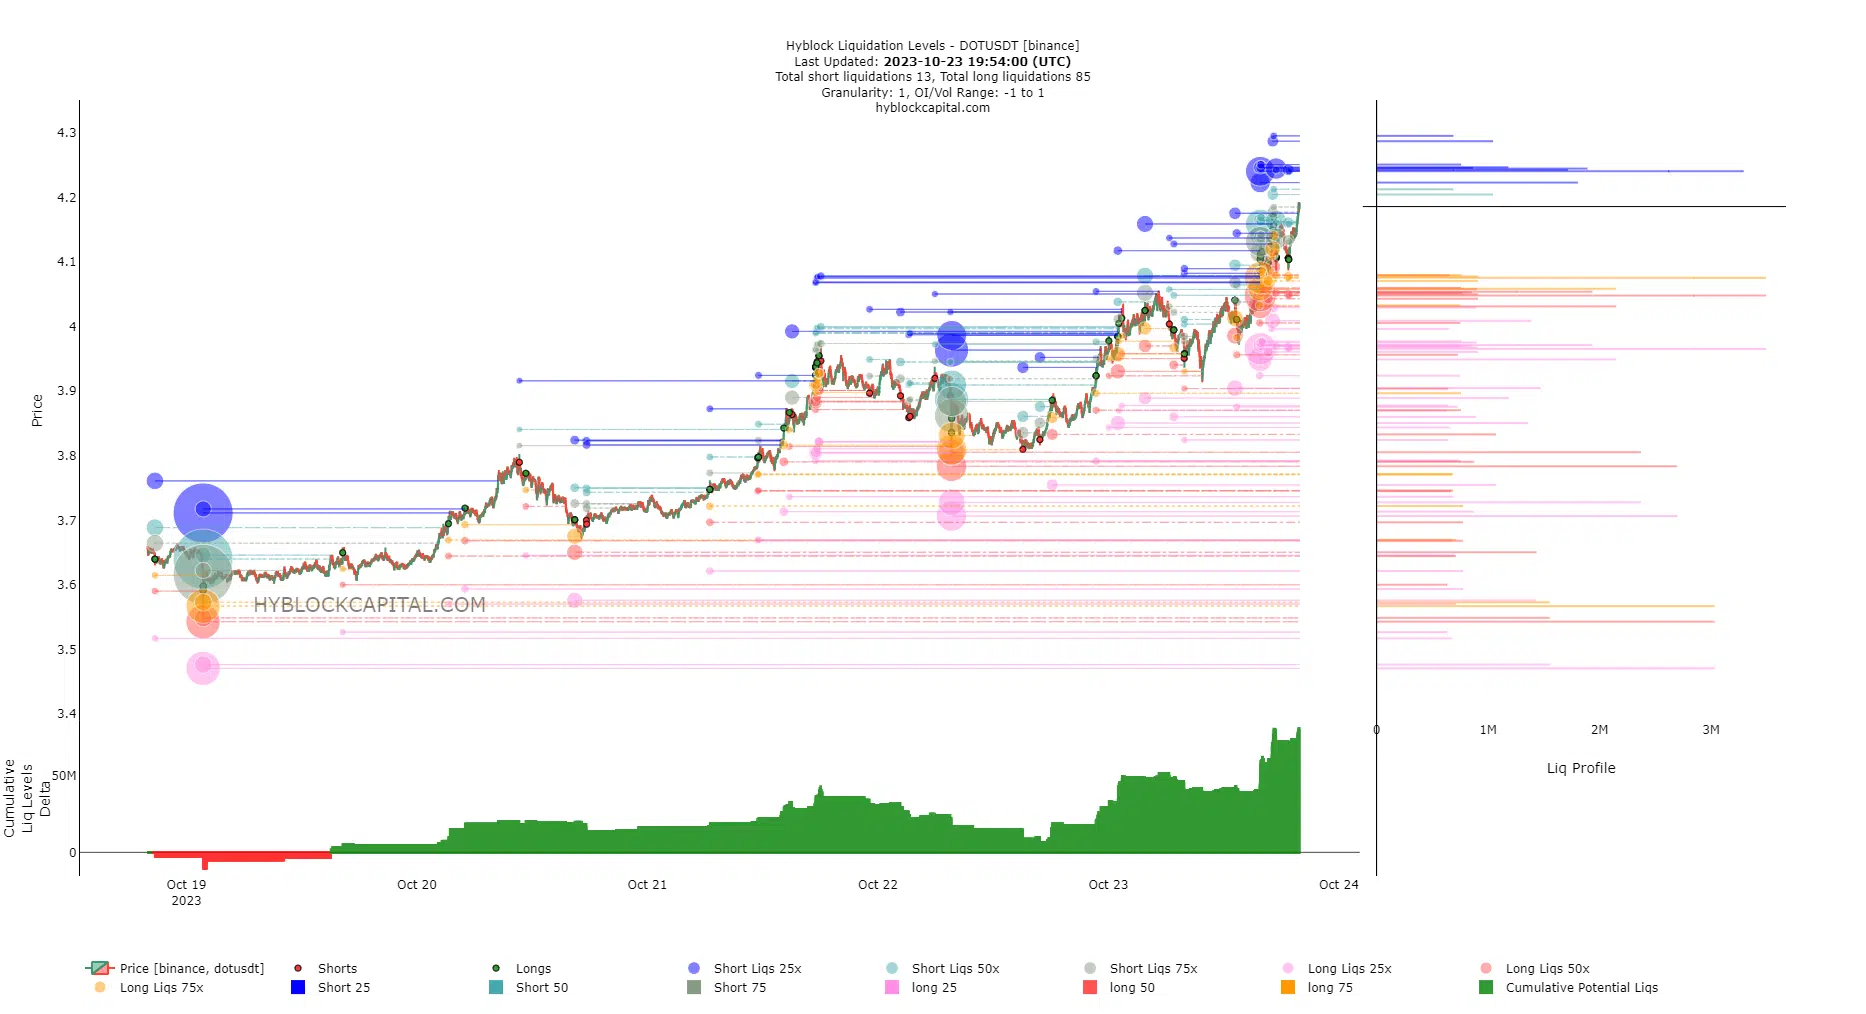
Source: Hyblock
The Cumulative Liq Levels Delta was firmly green amidst the strong uptrend DOT exhibited in recent days. This also meant that a retracement southward would hurt late longs. There was a $3 million short liquidation at $4.22-$4.24, close to the range high.
Is your portfolio green? Check the Polkadot Profit Calculator
A large number of short positions would also face liquidation upon a drop to $4.03-$4.05. A move to either level would likely see just over $3 million liquidated in short positions. Therefore the $4 mark was a juicy target for prices to hit before another move higher.
Hence, traders can wait for a dip to the $3.95-$4.03 region to reassess whether an opportunity to go long would arise. A drop below $3.95 would invalidate this idea.


