DOT traders should consider reading this before making a move

Disclaimer: The information presented does not constitute financial, investment, trading, or other types of advice and is solely the writer’s opinion
- Polkadot (DOT) has found new support at $5.0
- Negative sentiment could undermine effective price recovery
After breaking past several supports, Polkadot (DOT) finally found a calm zone at $5.0. At press time, DOT was trading at $5.38, up 5% in the last 24 hours. The hike corresponded with BTC’s recovery of the $16k-level.
Read Polkadot’s [DOT] Price Prediction 2023-24
Despite the price recovery at press time, however, the market structure was still weak. Therefore, DOT could continue to fall to its new support at $4.4.
New support at $5; will it hold?
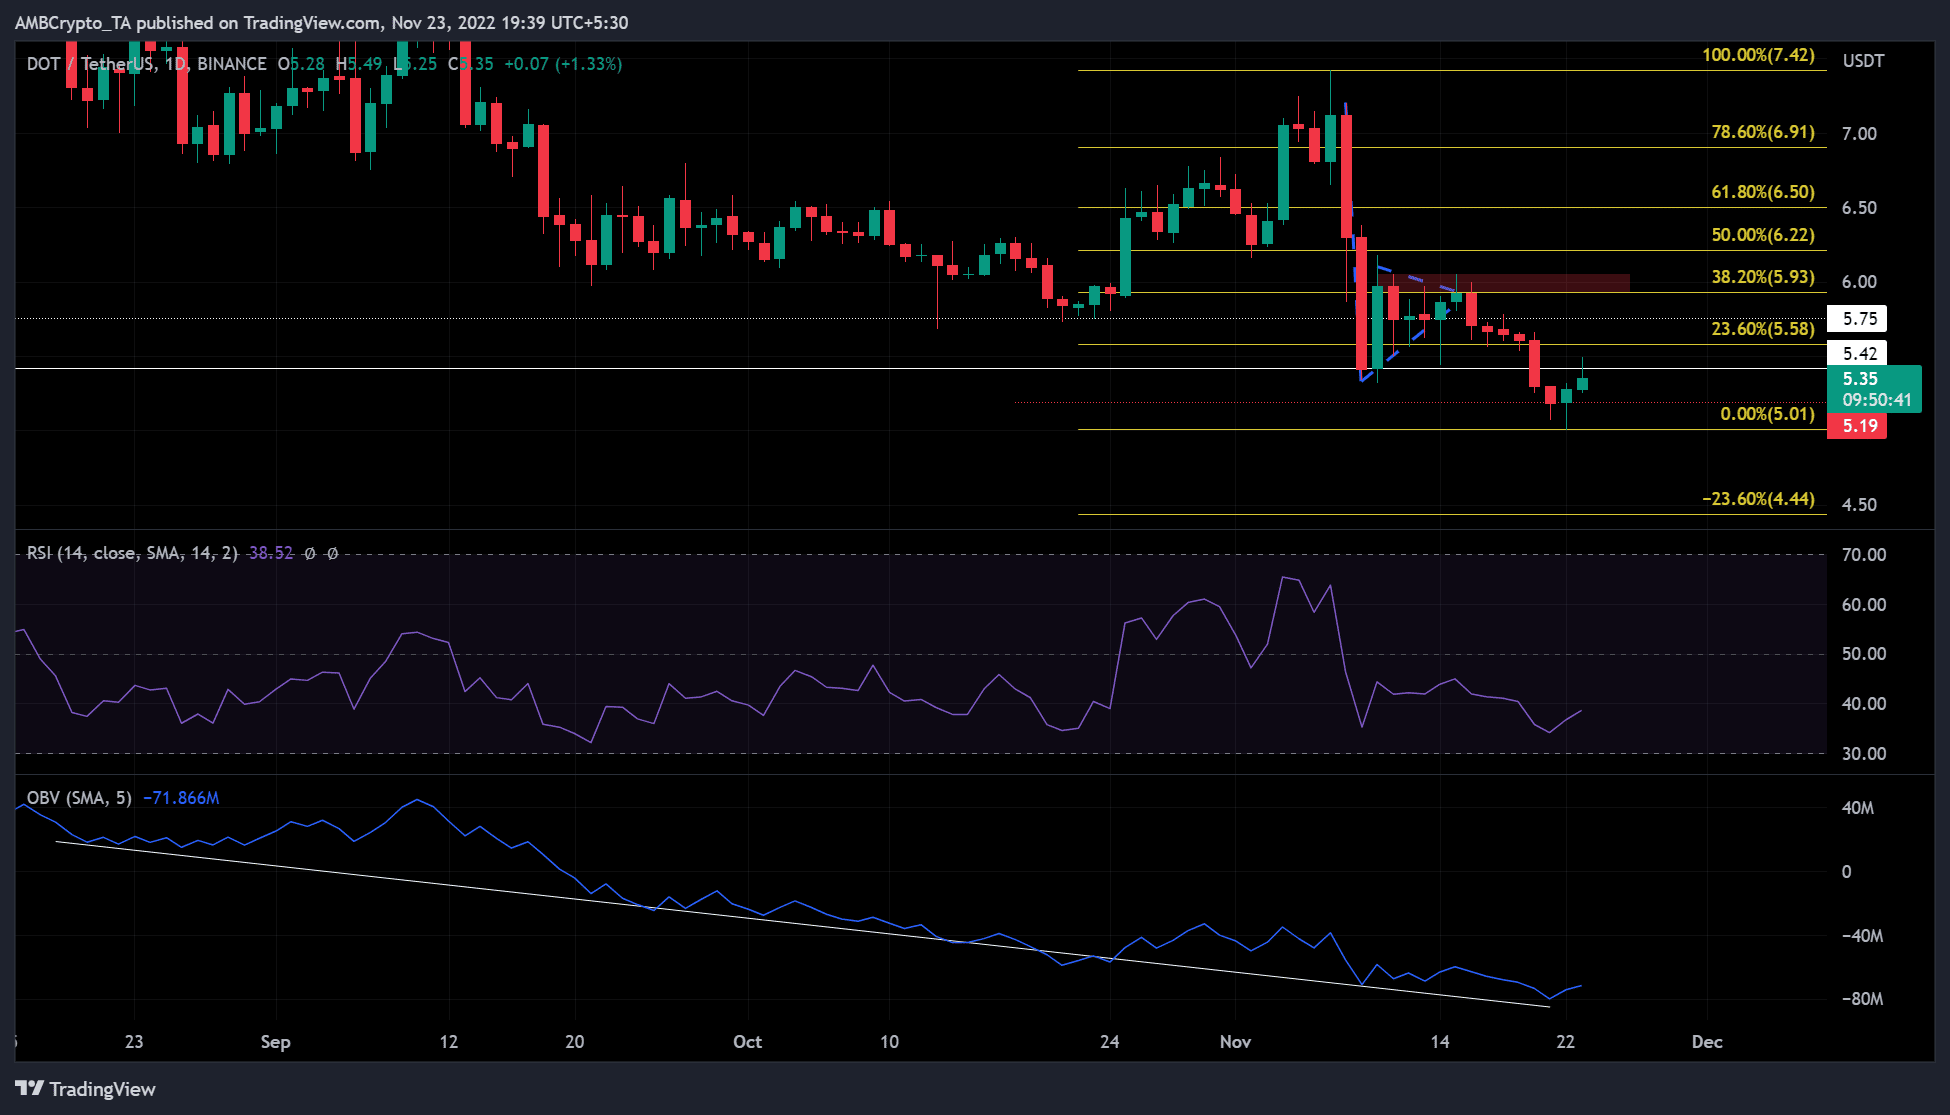
DOT registered an impressive rally between October and November, ending with an ATH of $7.42. However, bearish sentiment following the FTX implosion sent the asset crashing.
It found a support zone at $5.4, from which the bulls attempted two price recoveries. However, the two recovery attempts ended in a bearish order block around the 23.6% Fib level ($5.58). A price correction after the second recovery attempt fell below the previous support, turning DOT into a bearish market structure.
At press time, DOT was on the verge of a rally to break the $5.3-level. However, the current bearish market structure could push the price towards $5 or as low as $4.44 in the coming days or weeks. The Relative Strength Index (RSI) was at 38, showing that sellers have leverage.
On-balance volume has also hit a series of lows since mid-September. Ergo, both show that the market is still weak, favoring sellers.
However, the bearish bias will be invalidated if DOT breaks the 23.6% Fib retracement level ($5.58) on the intraday close. In this case, the new resistance target of DOT would be the bearish order block zone around the 38.2% Fib retracement level.
Negative sentiment and declining development activity
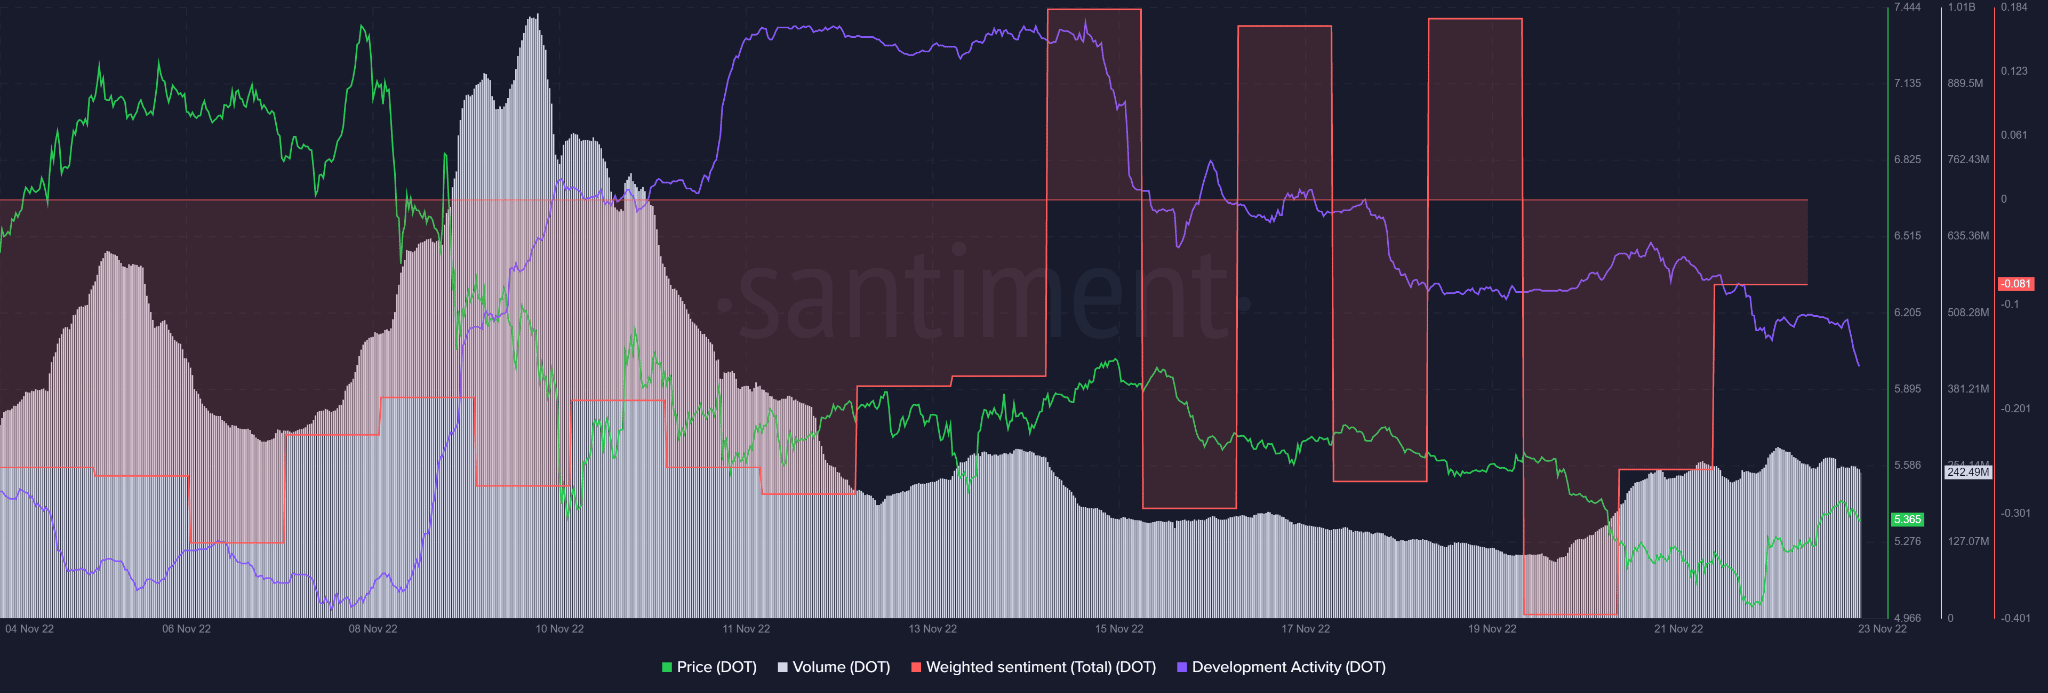
According to Santiment, DOT’s development activity bottomed out on 7 November before rebounding through mid-November. It declined steadily thereafter, with a steep downward trend at the time of writing. Interestingly, the price action followed development activity to a significant extent.
Moreover, the overall weighted sentiment was in negative territory at press time. Given the decline in trading volume as DOT’s price rises, the price-volume divergence may undermine strong buying pressure. This could point to a possible price decline or a deeper plunge.
If BTC holds $16,000 or breaks through $17,000, DOT could continue its ongoing rally. However, the price-volume divergence and negative sentiment could undermine any significant buying pressure that could turn the current market structure into an uptrend.
Long-term investors of DOT should therefore be cautious and monitor BTC, market sentiment, and development activity of the asset.


