
- Asset has been trading within a defined channel, with press time technical indicators suggesting a possible move lower
- A divergence between the Money Flow Index (MFI) and TIA’s price could have a say too
Celestia [TIA], at the time of writing, was facing a bearish trend, marked by a 7.47% decline in the last 24 hours. As expected, this pullback has partially erased the gains the altcoin accumulated over the past week. Especially in the face of increasing selling pressure.
Hence, it’s worth examining potential scenarios for TIA’s price movement as different market perspectives come to light. These perspectives might underline uncertainty, but also the possibility of significant price action on the charts.
TIA price movement analysis
At press time, TIA seemed locked in a month-long consolidation channel – A pattern that has persisted since July.
After encountering resistance at the upper boundary of the channel, TIA has registered a decline over the past two days. This bearish momentum could be a sign of a further drop, potentially driving the price down to the support level of $4.528.
That being said, a temporary reversal is possible. If TIA reaches the mid-term resistance at $5.52, a level where significant liquidity is concentrated. This could spark a short-term rally, pushing the price upwards before resuming its downtrend.
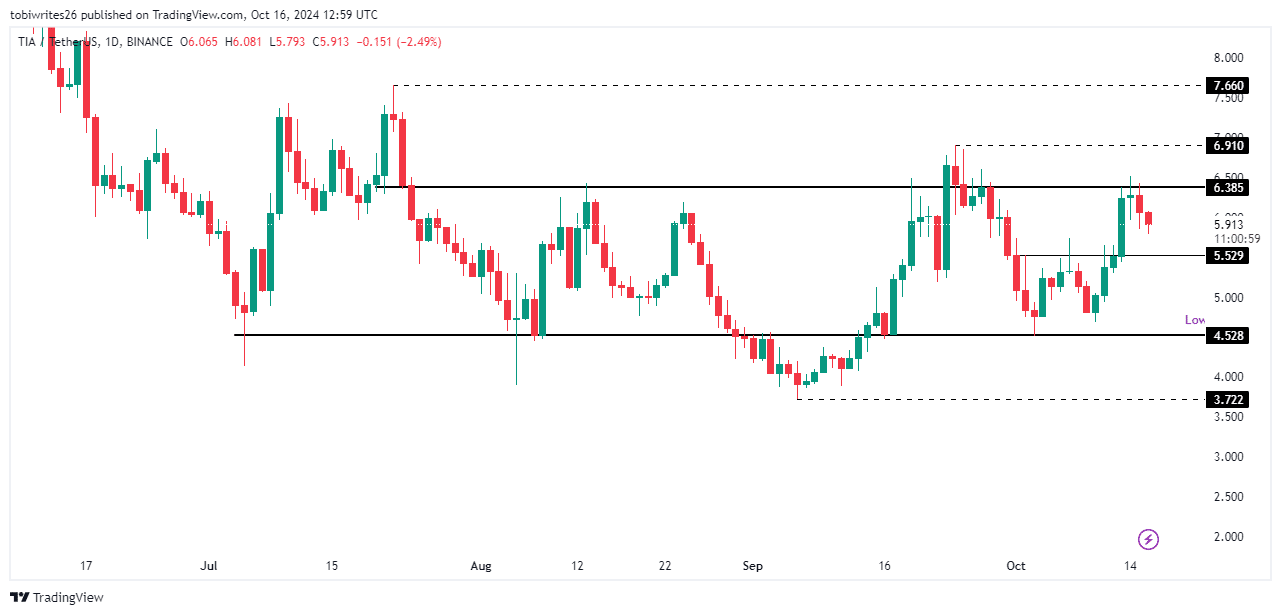
Source: Trading View
AMBCrypto’s analysis also revealed that the prevailing trader sentiment favors a sustained decline, with TIA expected to trend lower from its press time price of $5.895.
Traders are selling aggressively
There has also been a significant hike in selling activity for TIA. The same was indicated by various on-chain metrics, including the Funding Rate and Open Interest.
At press time, TIA’s funding rate had dropped to negative 0.0377%. A negative funding rate means that short positions are paying long positions – A sign that the contract price may be below the spot price.
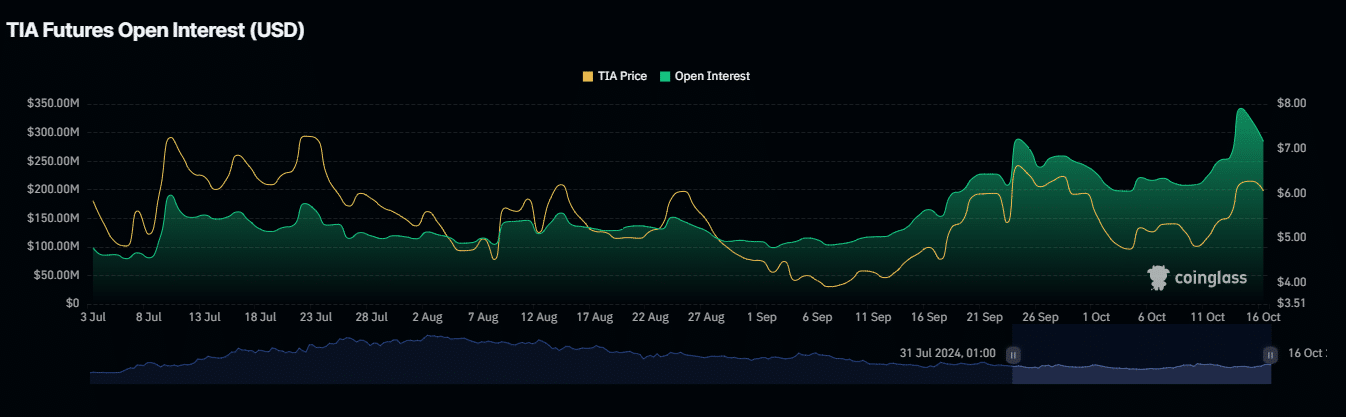
Source: Coinglass
If this negative trend continues, TIA is likely to decline further from its press time price level.
Additionally, Open Interest decreased by 4.14%, bringing its value down to $218.13 million. This implied that traders are increasingly opening short positions on TIA – A sign of bearish sentiment in the market.
Divergence suggested bullish momentum still exists
According to the Money Flow Index (MFI), a technical indicator that measures the inflow and outflow of liquidity in an asset, there is potential for TIA to change direction—Specifically, upwards.
At the time of writing, the MFI was trending north while TIA’s price was declining. This divergence pointed to a potentially bullish signal, indicating that despite the price drop, there may be increasing buying pressure or accumulation.
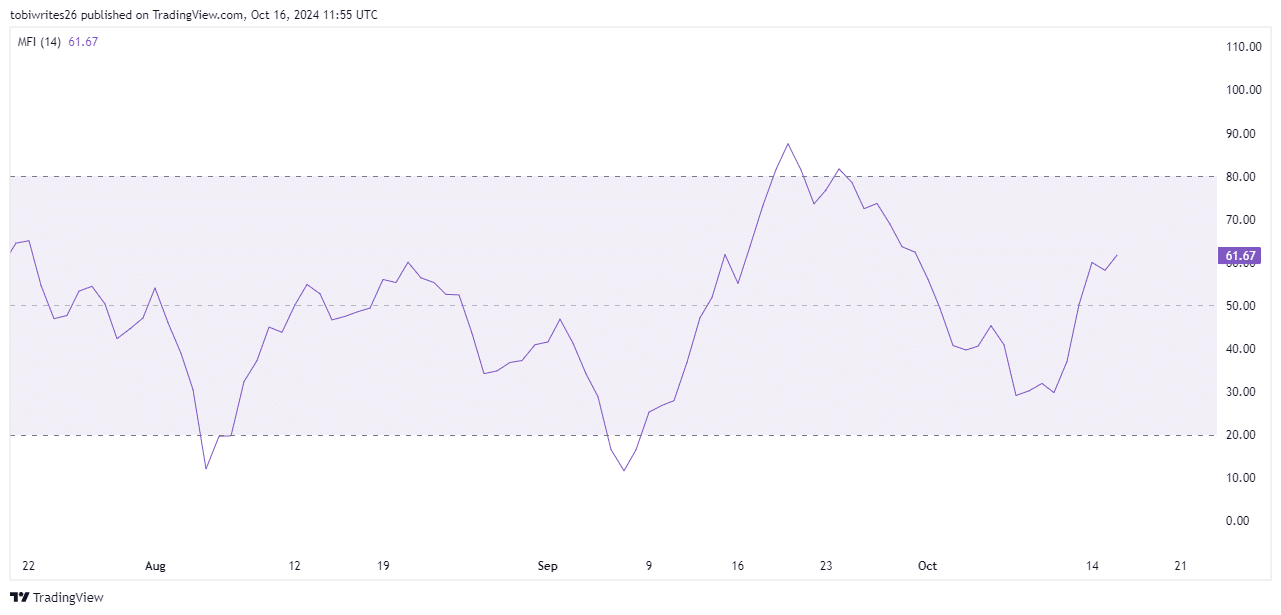
Source: Trading View
If this trend continues, a reversal could be on the horizon for TIA’s price action.