DYDX retraces into an HTF support, can we expect another surge upward?

Disclaimer: The information presented does not constitute financial, investment, trading, or other types of advice and is solely the writer’s opinion.
- Two important levels of support remain unbroken for DYDX.
- Higher timeframe bias remains bullish despite the lower timeframe downward momentum.
DYDX made enormous gains in January. Like the rest of the altcoin market, the birth of the new year brought a rally that has lasted close to six weeks. Periods of consolidation and pullback were witnessed during this run, and the token was going through another deep pullback.
Read DYDX’s Price Prediction 2023-24
If Bitcoin can regain its bullishness, DYDX could be one of the tokens which returns strongly to its previous bullish trend. This idea would be invalidated if the token fell beneath a higher timeframe support zone.
The $2.4 zone has seen consolidation in the past- and a bounce in recent days
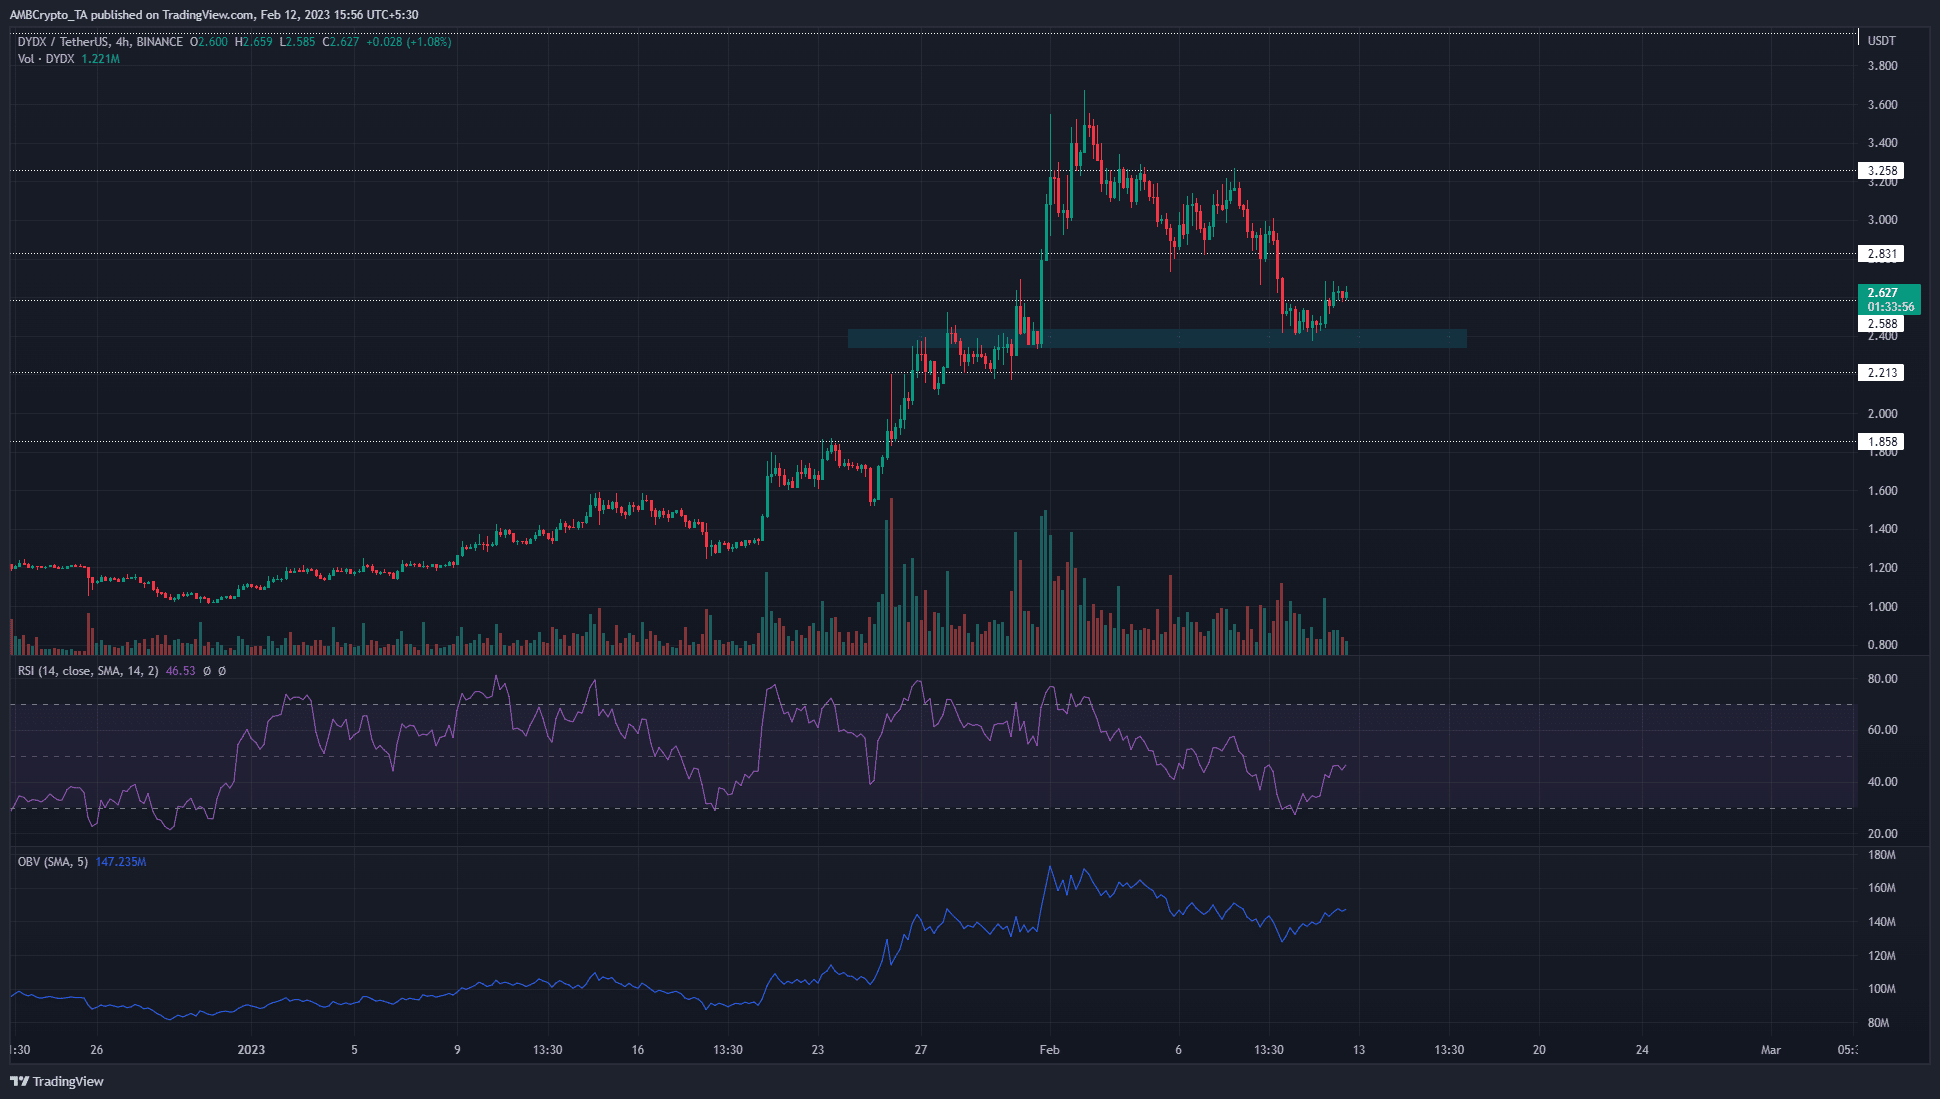
On the 4-hour price chart, it can be seen that the $2.4 region is not only an H4 bullish order block but also a zone beneath which the asset consolidated in late January. Following this phase of consolidation, a violent move upward occurred on 31 January.
Therefore, it is likely that this region will interest a large number of buyers.
The 4-hour RSI has not yet recovered to push above the neutral 50 mark, despite the near 10% bounce within the past three days.
Meanwhile, the OBV made lower highs, even though DYDX burst above the $2.8 resistance with vehemence.
Is your portfolio green? Check the dYdX Profit Calculator
Although the indicators did not show a sharp bullish disposition, the price action was promising.
Risk must be carefully managed, as Bitcoin sat at a critical support zone of around $21.6k.
Buyers could find some profits by buying the move back above the $2.6 level of support. To the north, $3.25 and $4 can be take-profit levels. Invalidation of this buy would be a drop beneath $2.2 on the daily timeframe, and $2.6 and $2.4 on lower timeframes.
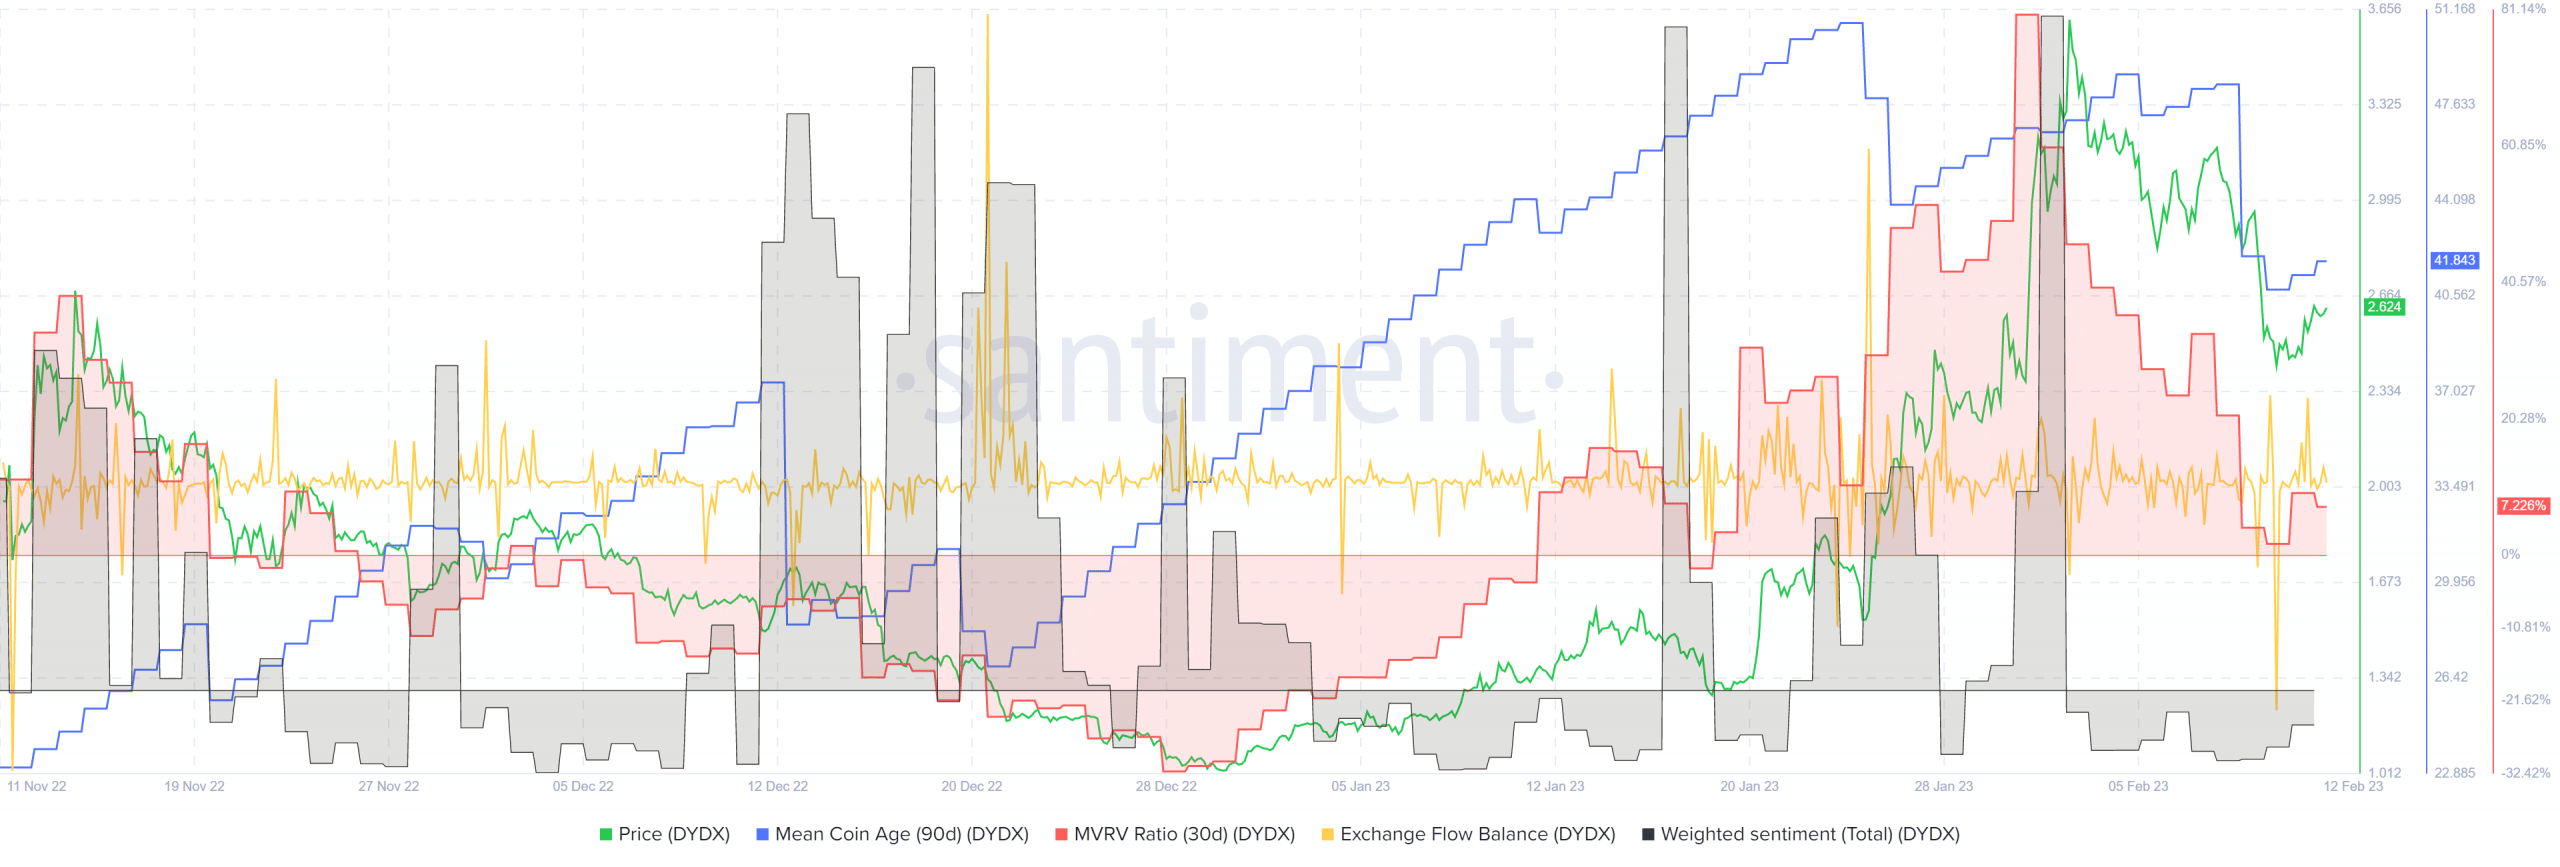
Meanwhile, the 30-day MVRV ratio fell toward the zero mark to indicate short-term holders had taken profits.
This was not a sign of bullishness, but it pointed toward the possibility that the selling pressure could soon abate. Weighted sentiment remained negative.
The mean coin age, which had been rising since late December, saw sharp drops in the latter half of January.
This signaled a spike in selling pressure. As things stand, this metric does not show a network-wide accumulation trend.
The exchange flow balance saw a large outflow in recent days. This hinted at accumulation but is not conclusive by itself.


