EOS, Aave, SushiSwap Price Analysis: 21 March

EOS maintained above the 200-SMA despite bearish presence in its current price level. Aave projected a breakdown from a descending triangle, while SUSHI could regain the $19.18-mark if buying picks up in the coming sessions.

For Bitcoin, however, the price was met with strong resistance around $60k and currently trades at $56,219.
EOS
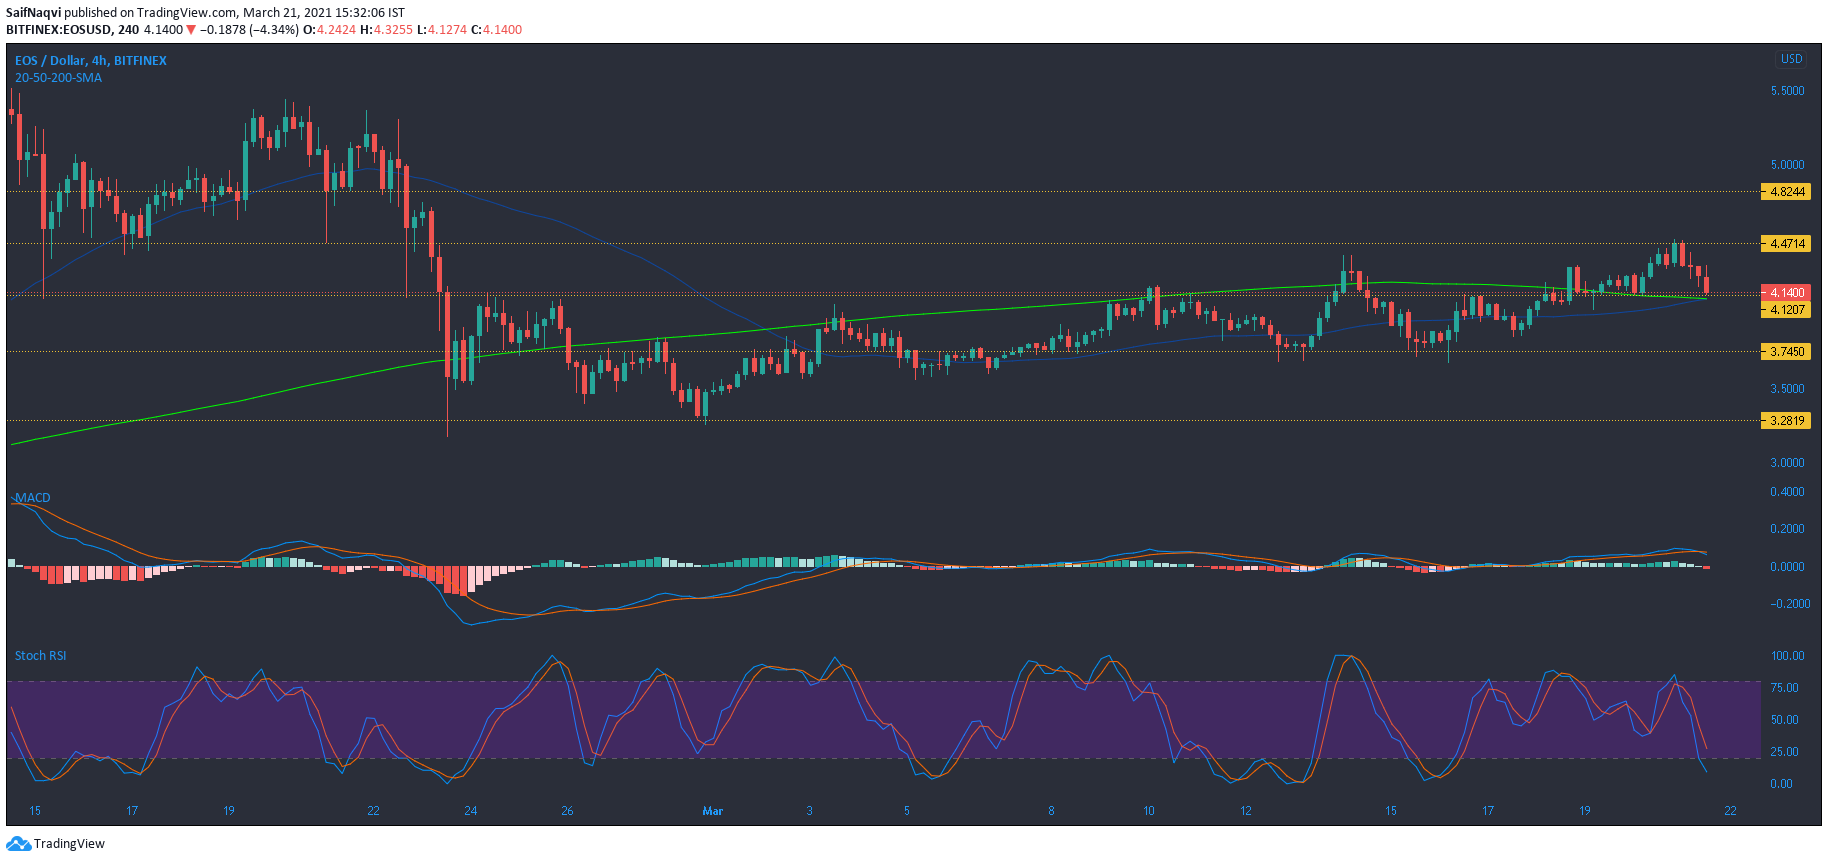
While EOS was restricted below its 200-SMA (green) for nearly three weeks, a rise above $4.1 resistance saw the price trade above the long-term moving average. A crossover between the 50-SMA (blue) and 200-SMA would also be a bullish development with regards to the long-term trajectory of the price. The short term target for the bulls resided at an upwards breakout from $4.47-resistance.
However, the bulls would first need to negotiate some bearish conditions in the market. The signal line rose above the MACD line, while the histogram noted some bearish momentum. Conversely, the Stochastic RSI moved in the oversold region and a reversal towards the upper zone would likely see EOS hold on to its press-time support.
Aave [AAVE]
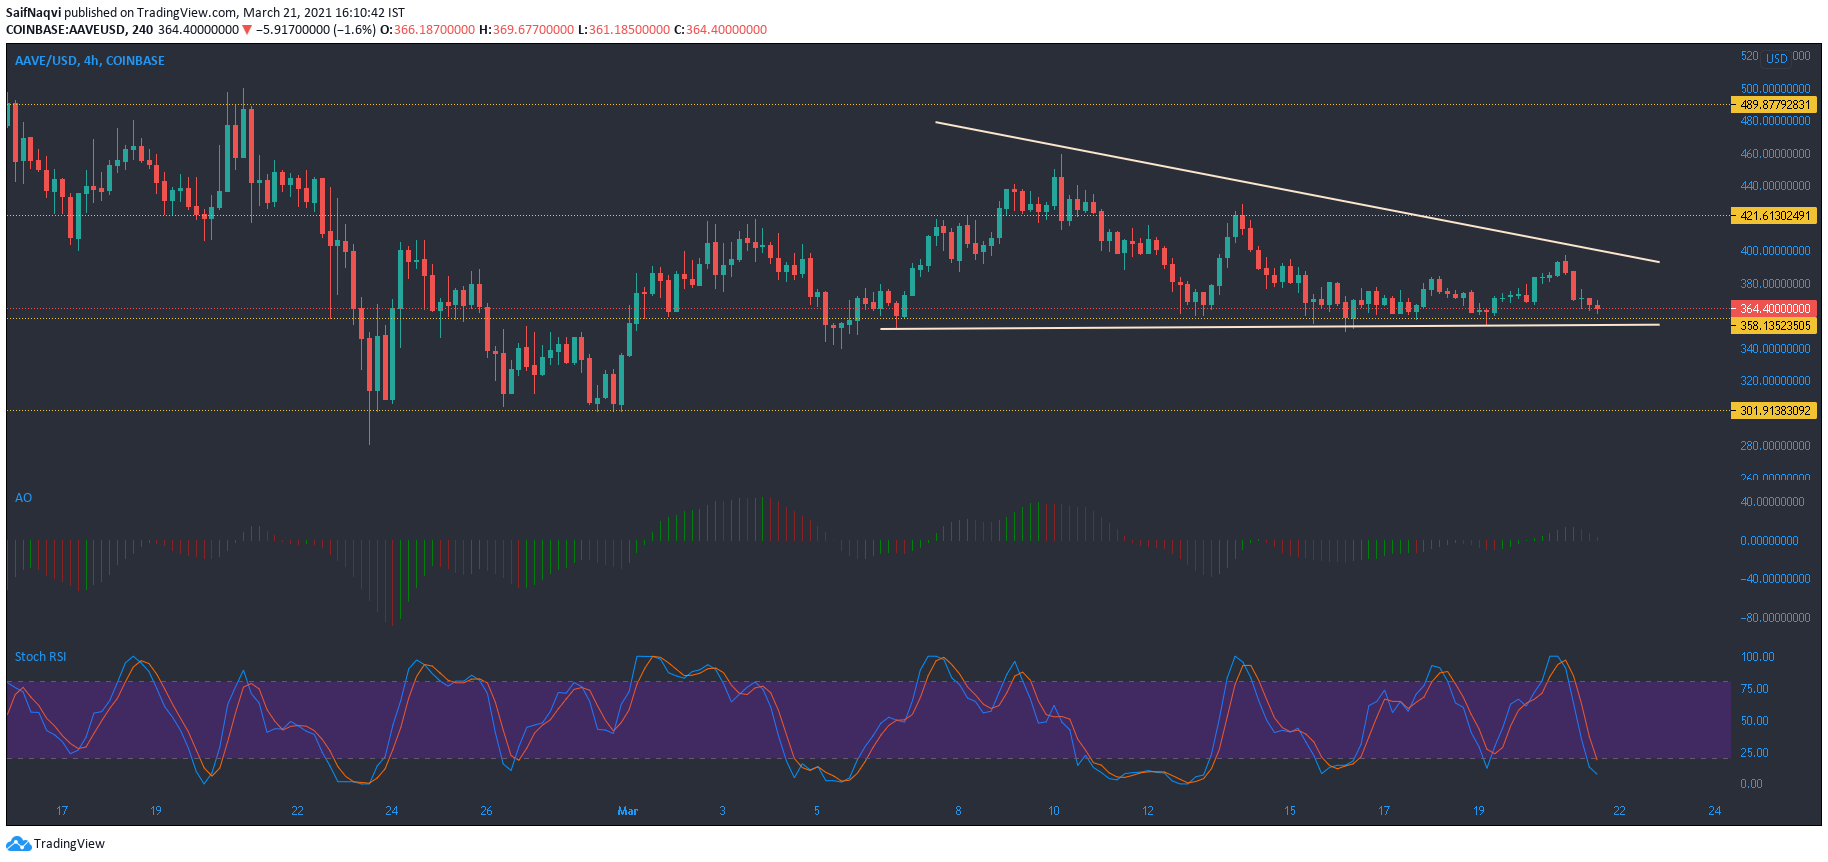
Since a pullback from the $450-mark, Aave snapped a series of lower highs on the 4-hour timeframe. This led to the formation of a descending triangle as the lows held steady at $358.1 support. A breakdown from the pattern would highlight support at $301.9. If the Awesome Oscillator notes an increase in bearish momentum over the coming sessions, the price would likely break below the lower trendline.
A bullish crossover in the Stochastic RSI, however, could invalidate the pattern and see Aave break above its upper trendline.
SushiSwap [SUSHI]

Losses now amounted to over 16% as SushiSwap fell from record levels and traded below $19.1 support at the time of writing. A sell-off at the current price level would see the price drop towards the next line of defense at $18.1. The Parabolic SAR’s dotted markers moved below the candlesticks and showed a downtrend after the crypto-asset lost out to the aforementioned support.
The OBV showed the lack of buying pressure and pointed downwards at press time. However, a pickup in buying activity would relieve some of the selling pressure and boost the price above the newly flipped resistance mark.