EOS, Ethereum Classic, Stacks Price Analysis: 14 April

EOS could push north of $8 after negotiating a minor dip towards $7.5. Similarly, Ethereum Classic was tipped to retrace towards $20 before the next upswing. Finally, Stacks was moving within a rising wedge, but the indicators were bullish at the time of writing.
EOS

Source: EOS/USD, TradingView
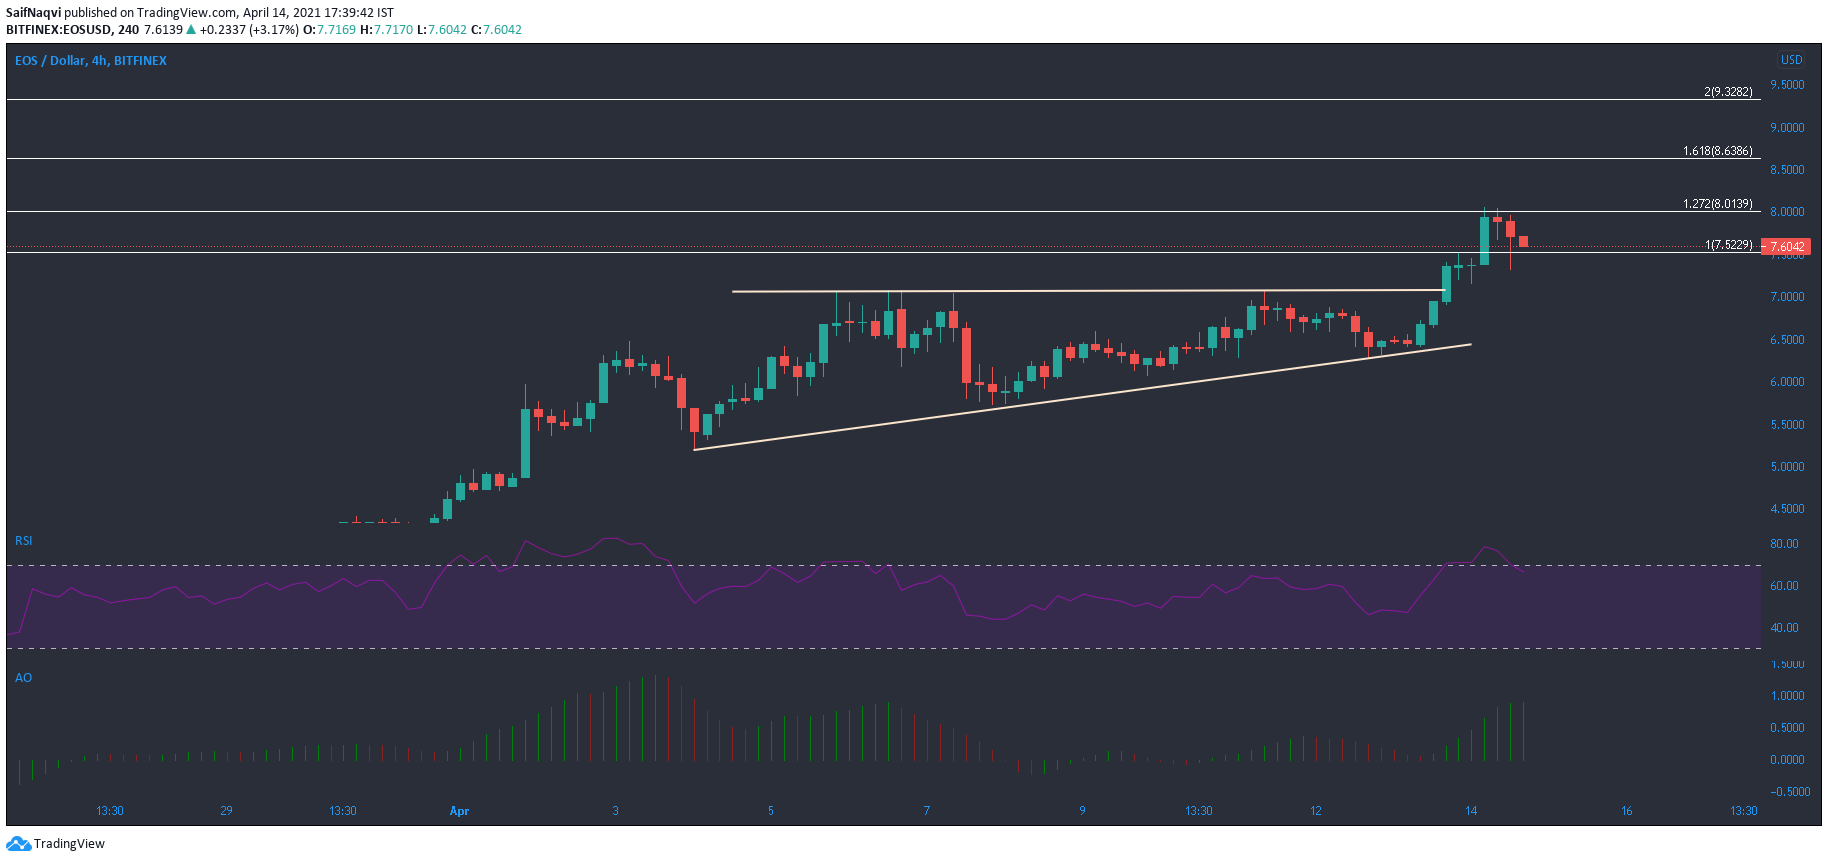
On the 4-hour timeframe, EOS saw a breakout from an ascending triangle which peaked at the 127.2% Fibonacci extension level at $8.01. A couple of bearish candlesticks appeared as the price was met with rejection at the aforementioned level. This also coincided with the RSI reversing trajectory from the overbought zone. Stabilization at lower levels, possibly at $7.5, would allow for another price swing in the coming sessions.
Despite the southbound move, momentum was still strong on the bullish side, according to the Awesome Oscillator. The 24-hour trading volumes were also up by 124%. In case of a bullish outcome, the 161.8% Fibonacci extension rested at $8.6, while the 200% extension lay at $9.3.
Ethereum Classic [ETC]

Source: ETC/USD, TradingView
A breakout from a symmetrical triangle pushed Ethereum Classic above the $21-level. Some selling took place at the aforementioned level, but the buyers were quick to respond at the $19.1-support. However, the price was trading on the upper band of the Bollinger Bands, and a minor pullback could take place and push the price towards its Signal line. This would highlight the support at $20.4.
A bearish divergence was also spotted on the MACD after it formed lower highs, and the histogram noted weakening momentum. Post the pullback, ETC would likely resume its northbound trajectory.
Stacks [STX]

Source: STX/USD, TradingView
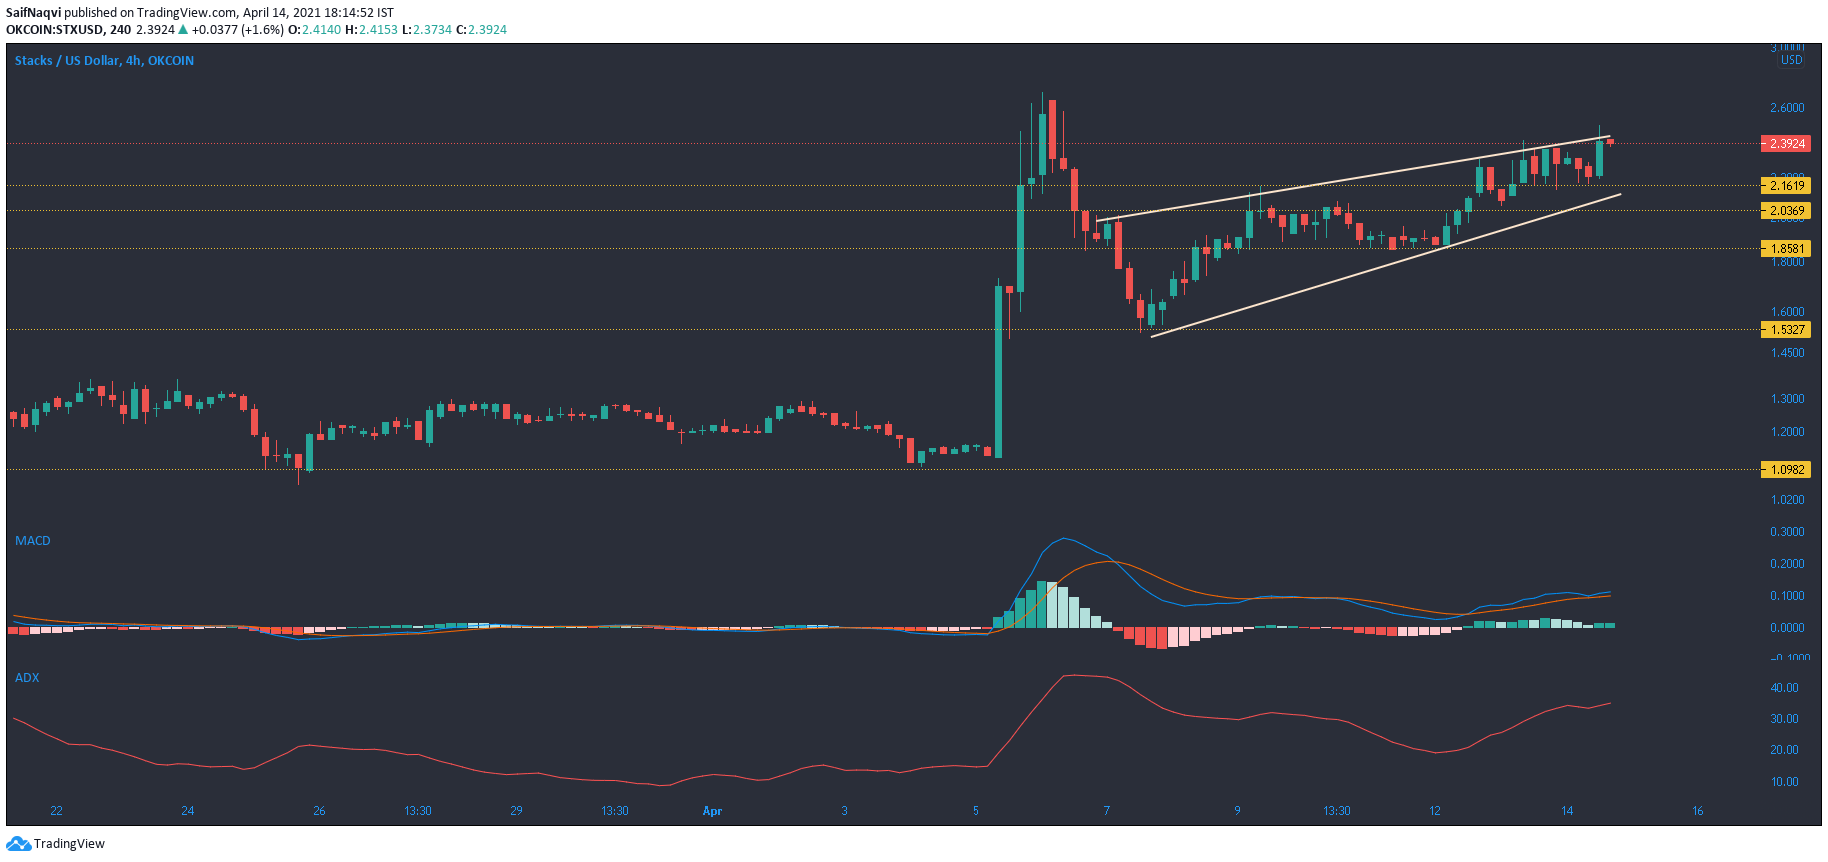
Stacks pictured a rising wedge pattern on the 4-hour timeframe and while this pattern usually sees a breakdown, a bullish broader market added some uncertainty in the mix. At the time of writing, the indicators also showed bullish strength in the market and backed a favorable outcome.
The ADX clocked in at 35 and indicated a strong trend for STX as the price made higher highs. The MACD also highlighted a bull market as the index was above the half-line and a bearish crossover seemed to be avoided. If this crossover does take place, the price could move south and towards the support lines of $2.o3 or $1.85.


