EOS, Polkadot, Neo Price Analysis: 12 January

After Bitcoin managed to claw itself back to the $34,000-level, the altcoin market posted slight gains on its charts. Similarly, altcoins such as EOS, NEO, and DOT were flashing green, at press time, as the market’s buyers alleviated some of the losses made over the past 24 hours.
However, there was uncertainty in the market as all three altcoins gave mixed signals and did not provide a definitive position moving forward.
EOS

Source: EOS/USD, TradingView
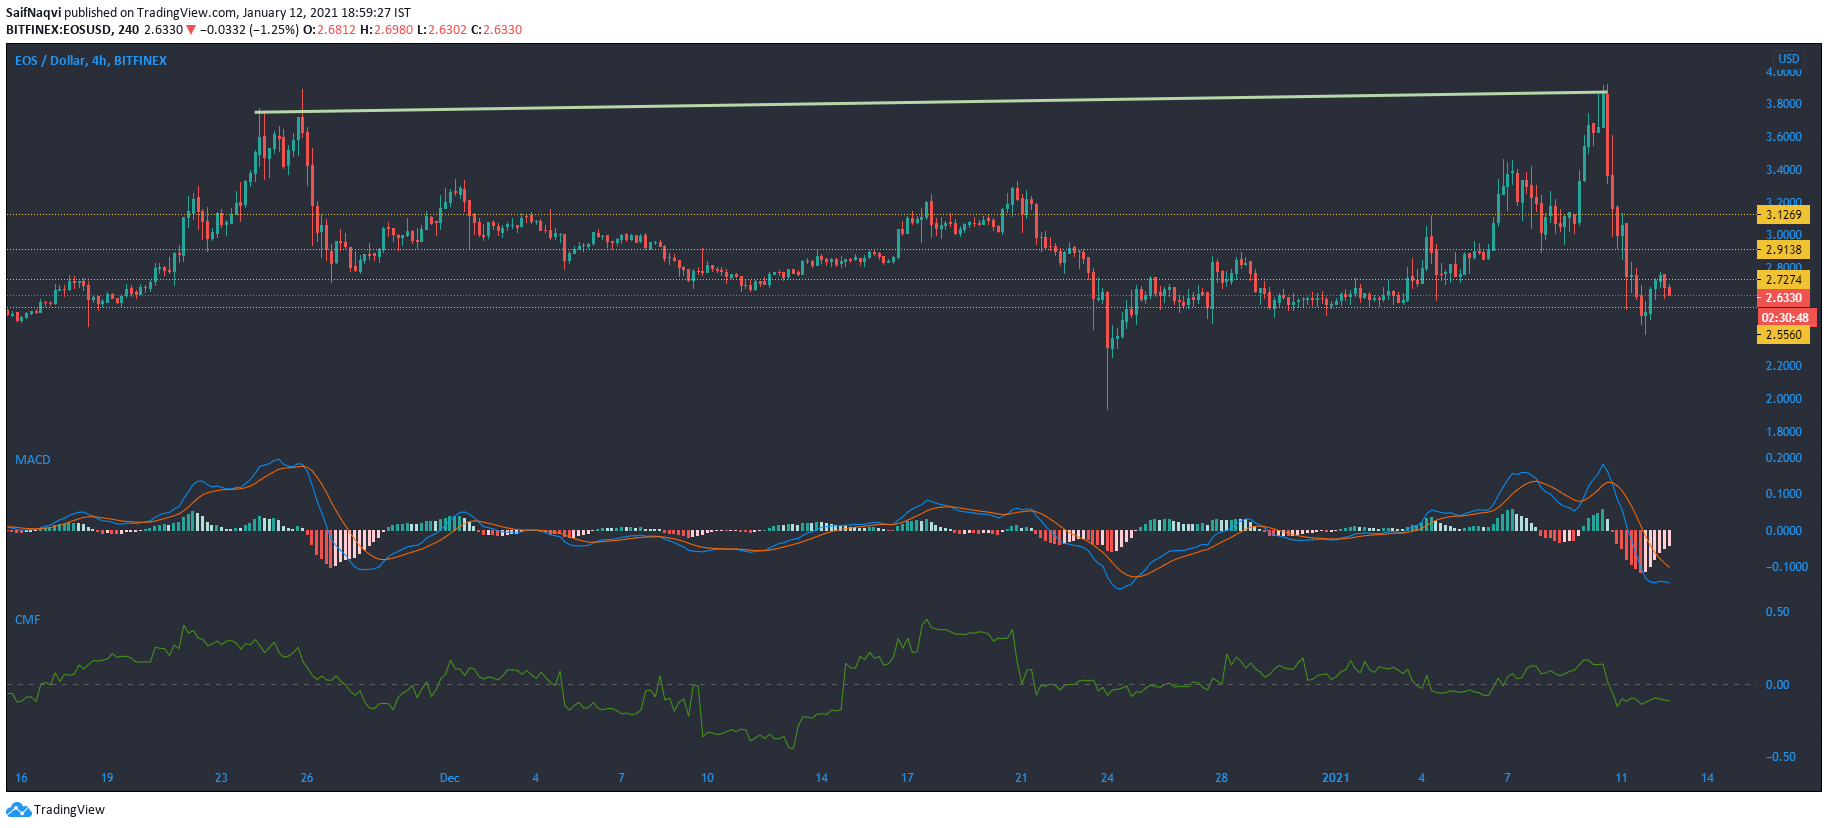
Panic selling over the past couple of days dragged EOS lower by over 30% before the market’s bulls finally cushioned the price at the $2.49-support level. However, EOS came in contact with a strong support level at $2.76 and the price moved slightly lower once again. The ongoing battle for control between the buyers and sellers could continue and the price could trade within its present channel over the next few trading sessions
The MACD showed that bearishness was decreasing in the market as the red bars fell in length below the equilibrium mark. A bullish crossover could boost the price beyond its current resistance at $2.76.
On the other hand, the Chaikin Money Flow stabilized below zero and showed subdued inflows of capital towards EOS. Consolidation between EOS’s press time channel seemed likely, unless capital pours back into the cryptocurrency.
Polkadot [DOT]

Source: DOT/USD, TradingView
Polkadot’s downward spiral halted at $7.52 as the buyers provided some relief to prices. For now, its movement was rather unclear as the price traded between $7.52 and $8.81 and did not show any signs of a breakout in any direction.
The cryptocurrency’s price traded on the lower band of the Bollinger Bands and moved towards the Signal line. However, bullish bounceback was not a certainty as the price could remain between the Signal line and the lower band unless a broader market rally pushes DOT towards the upper band.
The Stochastic RSI was slightly more decisive in proving a path forward for DOT as the index eyed a move in the overbought region. If the index does reach the upper territory, immediate resistance could be breached and the price could test the next ceiling at $8.81.
Neo [NEO]

Source: NEO/USD, TradingView
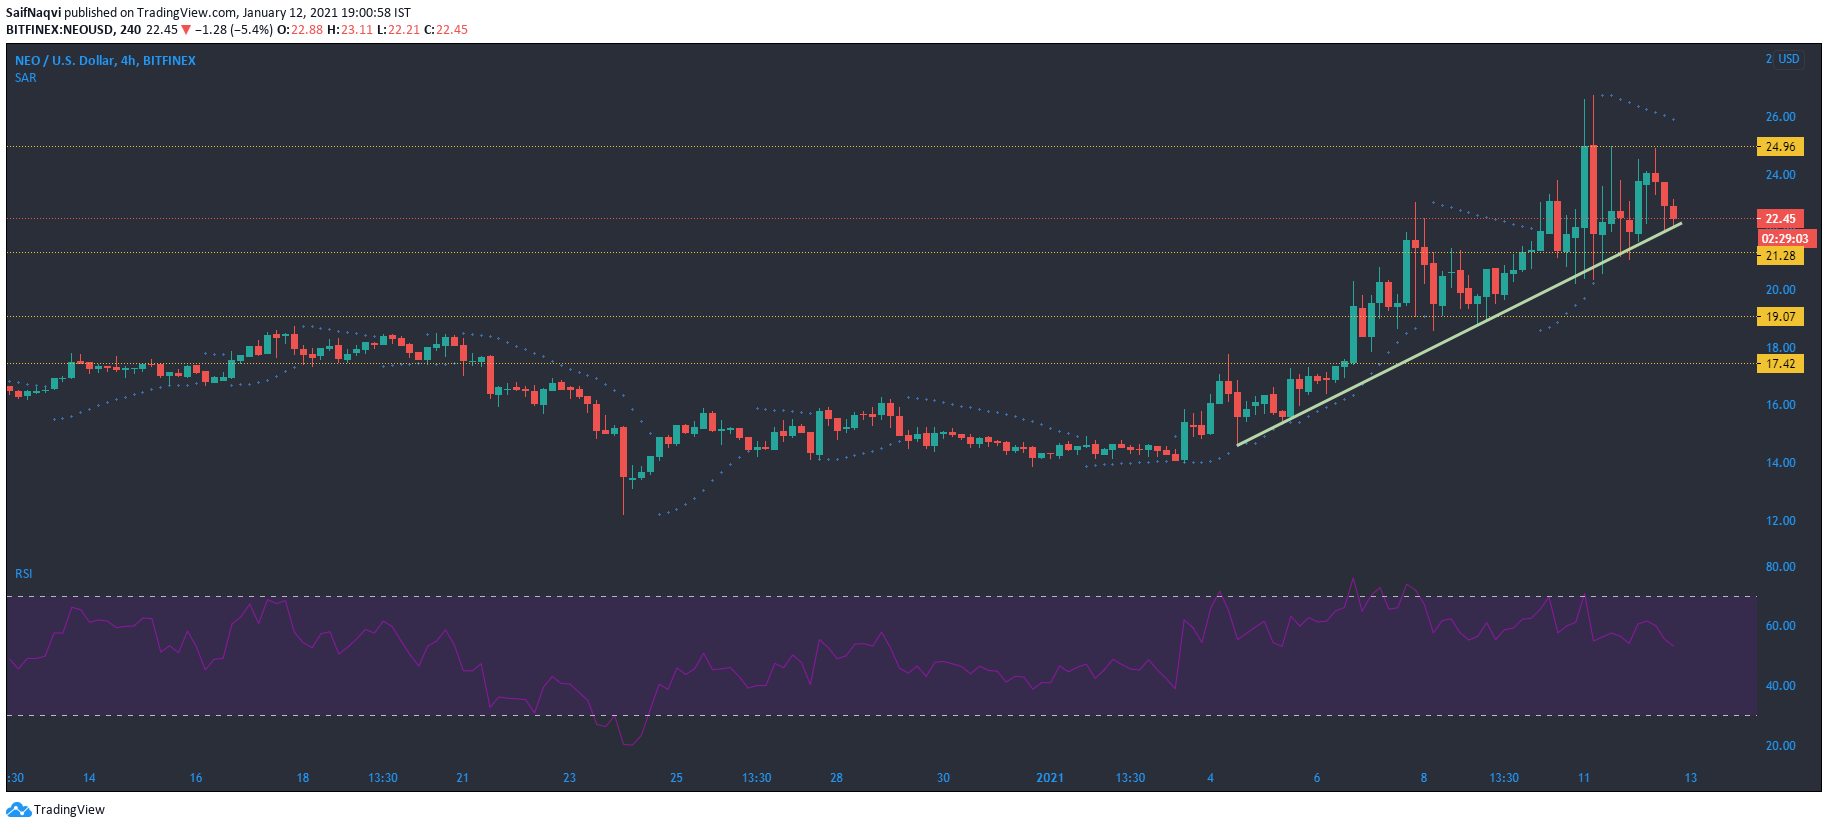
NEO fell towards its immediate support at $21.28 after failing to scale above the $24.96-mark. In the short term, the momentum could rest with the sellers as the indicators were largely bearish on NEO.
The Relative Strength Index was dipping towards the neutral zone. The immediate support level could be in danger of being breached if the index shoots towards the oversold zone in the near future.
The Parabolic SAR’s dotted markers were above the candlesticks and confirmed the bearish nature of the price.


