EOS reports strong TVL growth after deploying this strategy

- EOS benefits from a focus on dApps that incentivize staking.
- EOS price pattern shows signs of a possible bearish week.
The amount of liquidity or total value locked (TVL) is one of the yardsticks used to assess the health of blockchain networks. By this measure, the state of the EOS network looks more promising this year.
Is your portfolio green? Check out the EOS Profit Calculator
According to one of the EOS network’s latest updates, it has been experiencing growth and expansion of its DeFi ecosystem. But the interesting part is that EOS is achieving this growth thanks to a strategy called Yield+ initiative.
Diving deeper reveals that it involves incentivizing top dApps that boost the network’s TVL.
The #DeFi ecosystem on #EOS is expanding rapidly ?
This is largely thanks to the efforts of the Yield+ initiative, which aims to incentivize $EOS #dApps that increase TVL & generate yield ?
Learn more in the latest report?https://t.co/PjL1oU20bO pic.twitter.com/PahKWJme4G
— EOS Network Foundation (@EOSnFoundation) January 27, 2023
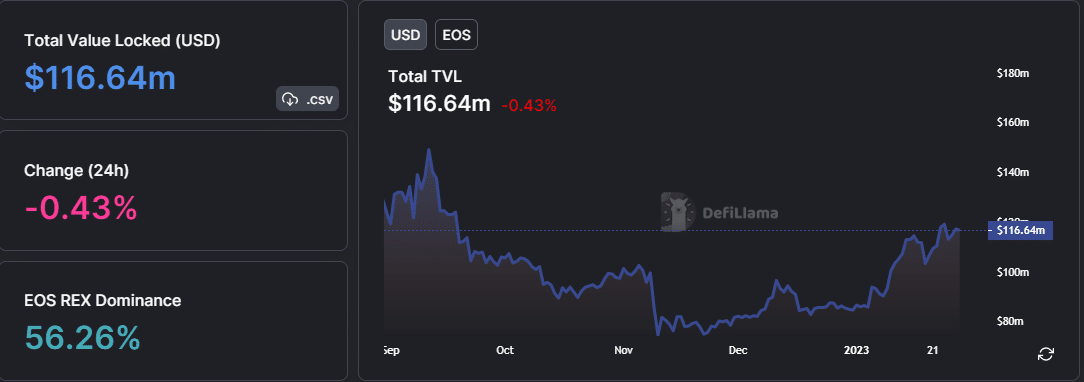
The update suggests that the network is achieving healthy organic growth. An evaluation of EOS’ TVL on DeFiLlama confirms that it has indeed been on a positive trajectory from its bottom range in November.
Despite this, the TVL still has a long way to go before recovering to last year’s highs.
Nevertheless, the TVL upsurge is good news for EOS investors since it confirms a positive shift for the network. It reveals that liquidity has been flowing into the ecosystem and is perhaps a reflection of the shift to bullish market sentiment.
A comparison between the TVL with the market cap reveals that the TVL pivoted weeks before the bullish recovery kicked off. This begs the question of whether the TVL shift was a healthy early warning sign.
What we can learn from the EOS price chart
There are many factors that affect the levels of demand or sell pressure in the market. However, investor psychology often lends some degree of legitimacy to the chart patterns.
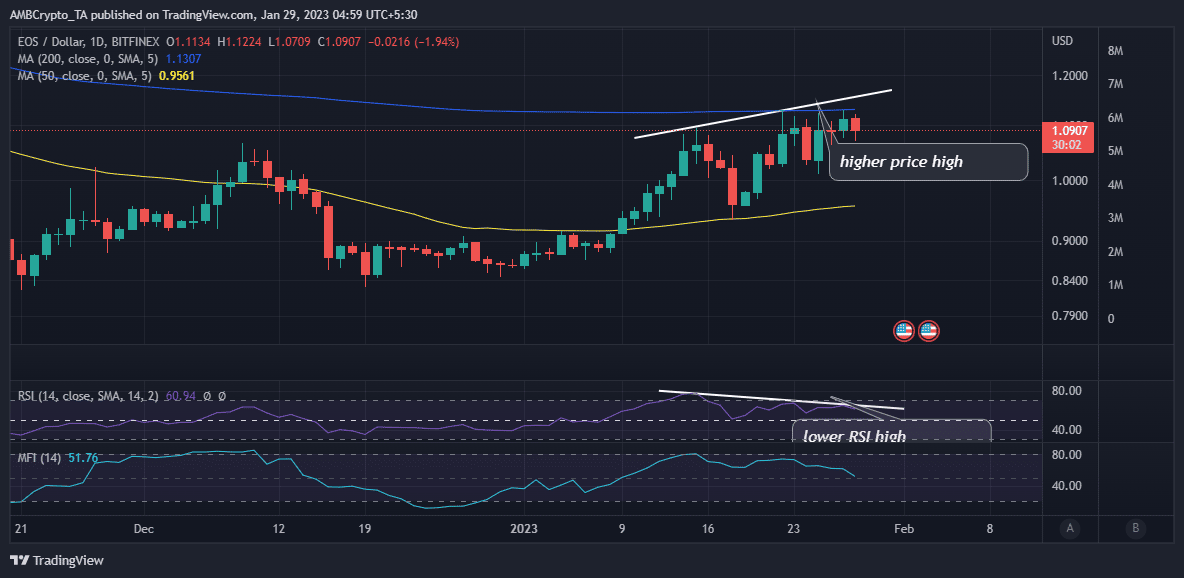
If this happens to be the case with EOS, then we can expect some more sell pressure and a price decline in the next few weeks.
This is because of the price-RSI divergence pattern that formed in the last two weeks.
The price-RSI divergent pattern is often associated with a sign that the trend is losing momentum, and a pivot will follow.
While this is currently the more probable option based on the aforementioned pattern, it does not necessarily have to be the case. The bulls might still regain control, especially in case strong demand manifests in the next few days.


