
The larger altcoin market, at press time, remained relatively volatile after a hike over the last two days was followed by a 4% dip in market cap on June 15. However, some altcoins like EOS, VeChain, and Cosmos oscillated within constricted ranges and noted low volatility. On the 4-hour chart, short-bodied candlesticks for EOS highlighted that market action was low for the asset. VeChain and Cosmos, on the other hand, noted slight gains.
EOS
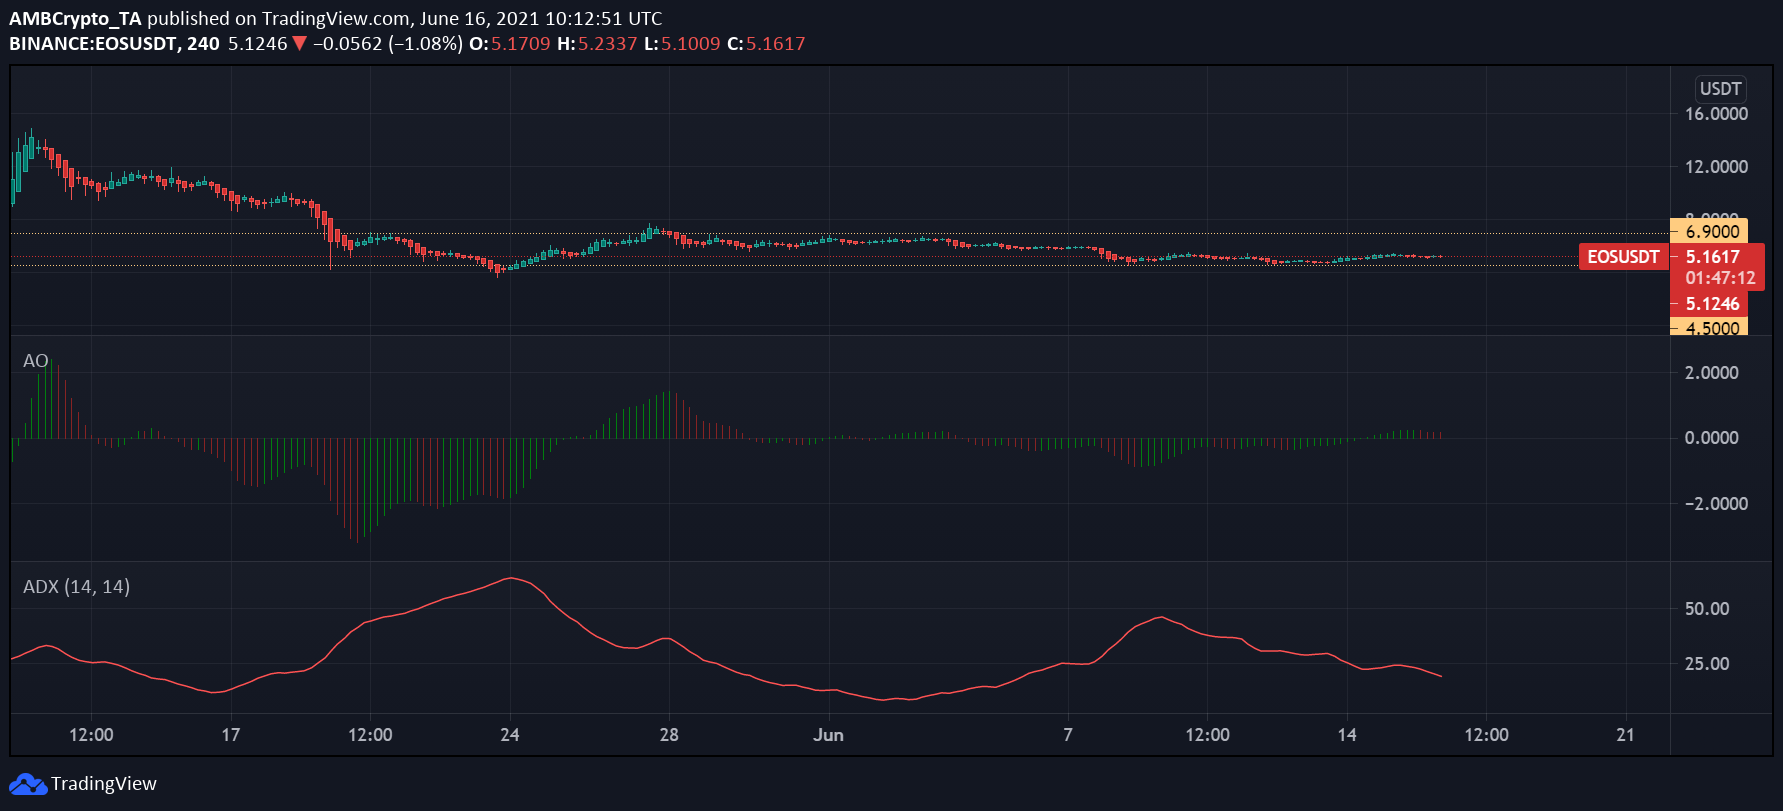
Source: EOS/USD – TradingView
In spite of EOS ‘s three-year anniversary of its mainnet activation on June 14, the asset continued to move within its restricted price channel between the $4.5 support and $6.9 resistance. The slight signs of recovery from its sideways price movement which were highlighted in a previous analysis were followed by low price action at press time.
The asset traded at $5.1 at the time of writing as the Awesome Oscillator highlighted a moderately bearish momentum creeping with the appearance of red bars above the zero-line. Short-bodied candlesticks for EOS highlighted that market action was low.
Further, the Average Directional Index (ADX) was below 25.0, highlighting a less directional market and the absence of any prominent trend.
VeChain [VET]

Source: VET/USD – TradingView
VeChain traded at $0.1106 at press time and saw a 24-hour price fall 1.72% and a 7-day drop of 2.42%. The slight price uptrend towards the end of June 13 initiated bullish momentum, as depicted by the Parabolic SAR since the dotted line remained under the candlesticks.
VET was down 58.34% from its ATH 58 days ago and had a breakeven multiple of 2.40. Capital inflows for the asset saw a slight rise as the indicator showed a tiny uptick at press time, according to the Chaikin Money Flow.
Further, the MACD line moved in rather close proximity with the Signal line, something that could mean that a bearish crossover was in store for the asset if the price falls further below. VET’s next resistance level was at $0.12 and its key support level was at $0.09.
Cosmos [ATOM]

Source: ATOM/USD – TradingView
ATOM, ranked 43rd on CoinMarketCap, had a 24-hour price dip of 3.66% & and a 7-day price fall of 6.06%. Its price showed slight signs of recovery at press time with the appearance of green candlesticks on the 4-hour chart.
The Squeeze Momentum Indicator pointed to an active squeeze release (white dots). While the ongoing trend, according to the indicator, was bullish, the appearance of the squeeze release coupled with dark green bars could mean that a trend reversal might take place.
The creeping bearish trend was also highlighted by Parabolic SAR’s dotted line that remained above the candlesticks. Further, Bollinger Bands for the asset highlighted an almost parallel trend and pointed to steady volatility. Cosmos’s 30-day volatility was 2.34, at press time.