Ethereum, ATOM, Tron, ETC Price Analysis: 11 April

Despite the recent selling spree, Ethereum bulls have held on to the $3,100 support whilst the king alt showed gradual improvements on its 4-hour RSI. Similarly, Cosmos buyers showed up in the $25-$26 range to stall its ongoing sell-off.
On the other hand, Tron witnessed a death cross of its EMAs on the 4-hour timeframe while ETC fell below its Point of Control.
Ether (ETH)
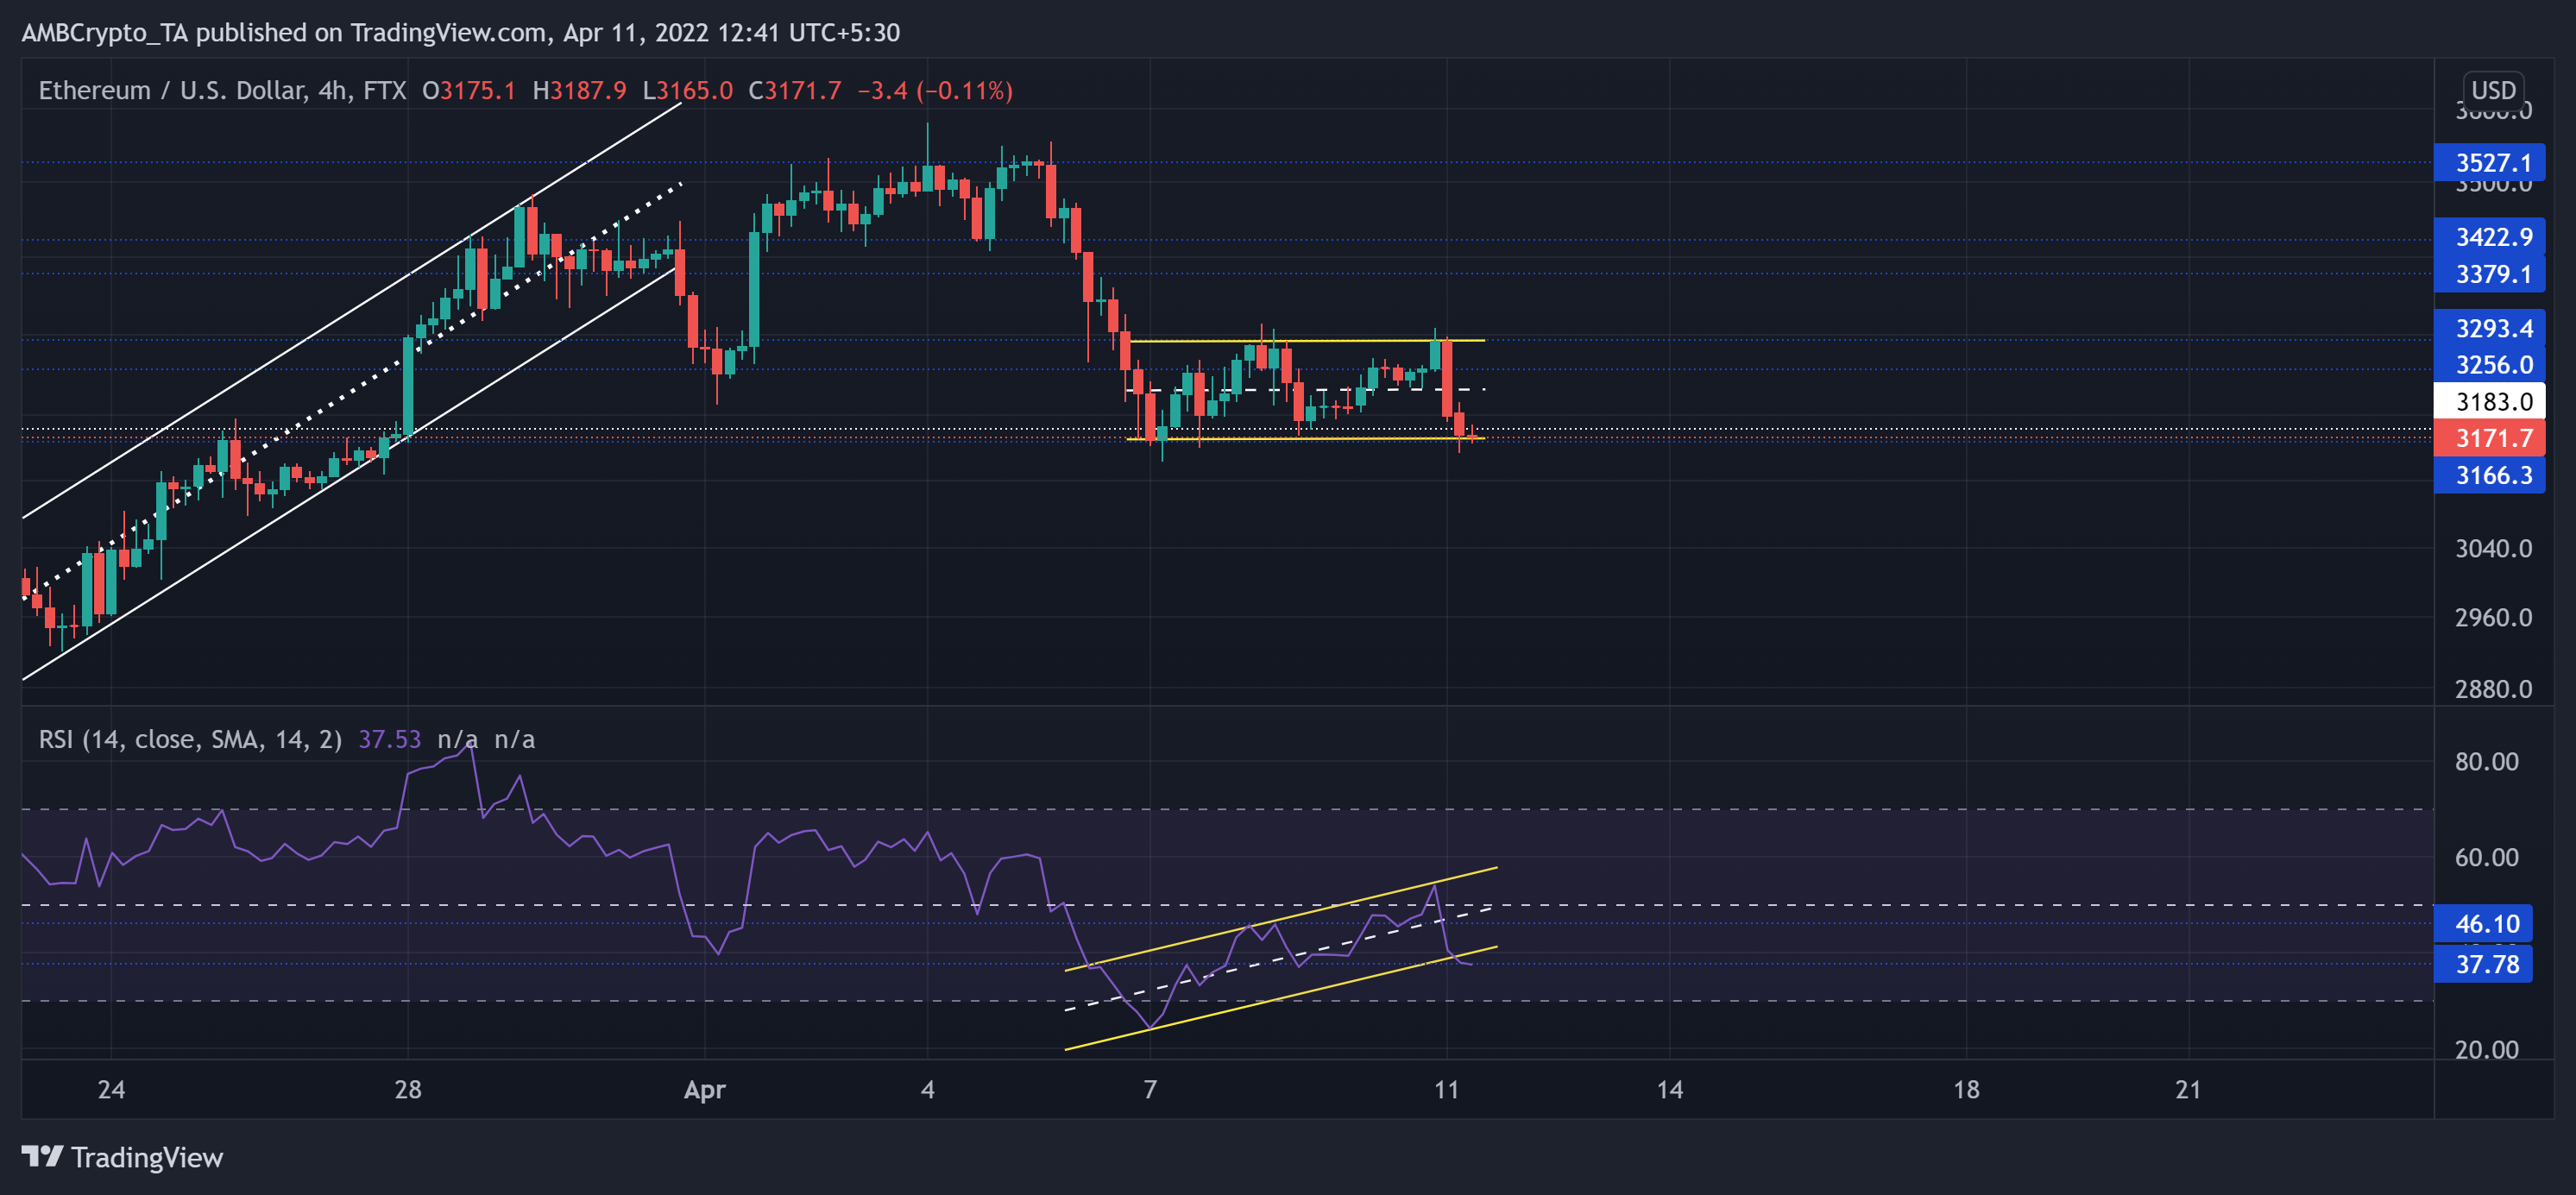
During its slump phase, ETH lost the crucial $3,500-mark while the bears flipped this level to immediate resistance. The bearish rally led ETH to lose more than half its value as it fell towards its multi-month low in late January.
Since then, the alt grew by nearly 47% in the last 11 weeks. Recently, ETH saw an up-channel breakdown from the $3,500 resistance. As the $3,100 support stood sturdy, the alt briefly consolidated in a Rectangle (yellow) on its 4-hour chart.
At press time, ETH was trading at $3,171.7. After a reversal from the oversold mark, the bearish RSI bounced back in an up-channel. Any close below the 37-support could lead to further retracements.
Cosmos (ATOM)

ATOM found an oscillation range between the $25-$34-makr for over five weeks. The recent sell-off phase led ATOM to lose nearly 22% (from 3 April) of its value until it touched its one-month low on 11 April.
Soon after, the bulls stepped in at the $25-$26 range. From here on, the 20 EMA (red) would be an immediate hurdle for the bulls. At press time, ATOM was trading at $26.39. The Supertrend continued to be in the red zone and favored the bearish vigor.
Tron (TRX)
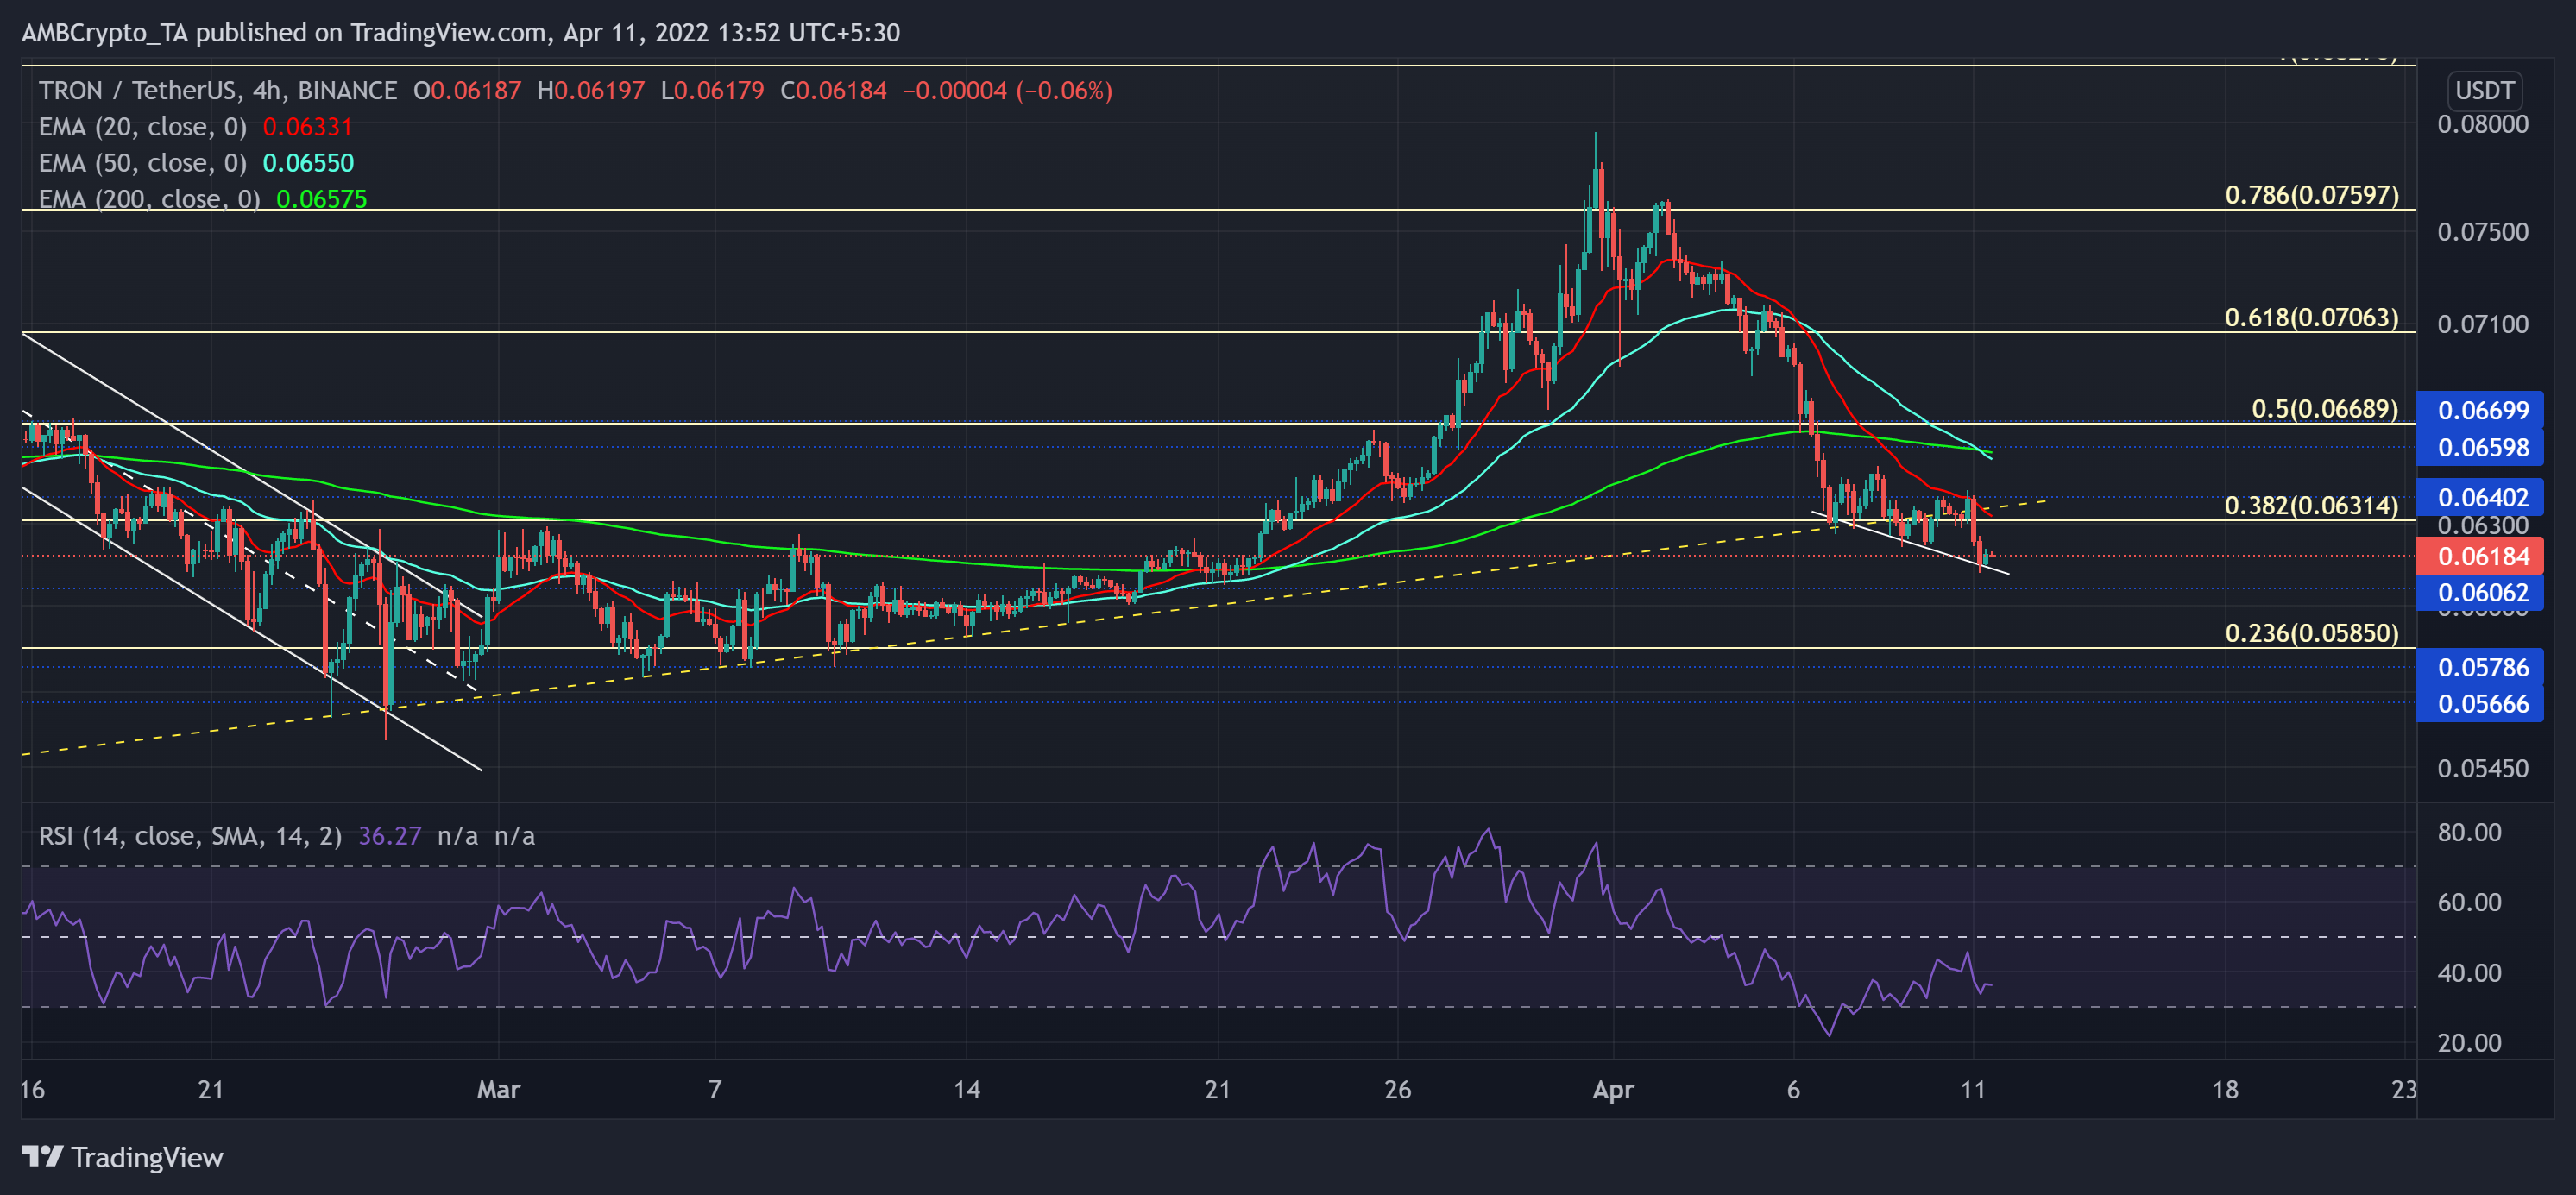
Since its January lows, the bulls propelled a gradual recovery that was short-lived by the 78.6% Fibonacci resistance. Further, The 61.8% Fibonacci level posed some problems in the bullish recovery attempts from the $0.05 floor.
Consequently, the bears breached the 11 week trendline support and flipped it to resistance. Also, the 20 EMA (red) and 50 EMA (cyan) fell below the 200 EMA (green). Thus, revealing a death cross on its 4-hour chart.
At press time, TRX traded at $0.06184. The RSI’s recent recovery from the 24-level has projected a bullish divergence with the price. Thus, a possible revival could face resistance near the 38.2% level.
Ethereum Classic (ETC)

ETC lost more than 66% of its value from its November highs and touched its nine-month low on 22 January. Since then, the altcoin saw an aggressive 87.8% recovery in the last three months.
As a result, it touched its four-month high on 29 March. Since then, the sellers provoked a down-channel retracement that pushed ETC below its Point of Control (red). At press time, ETC traded at $0.0. The CMF swayed below the zero-line and revealed a bearish edge. But with the recent fall, it saw a hidden bullish divergence with price as the oscillator looked north.


