
Ethereum’s indicators showed that its downtrend was losing steam as the world’s largest altcoin bounced back from the $1,300 level. Bitcoin SV and VeChain lacked the volume to break above their respective resistance levels, and are likely to be rangebound over the coming sessions.
Ethereum [ETH]
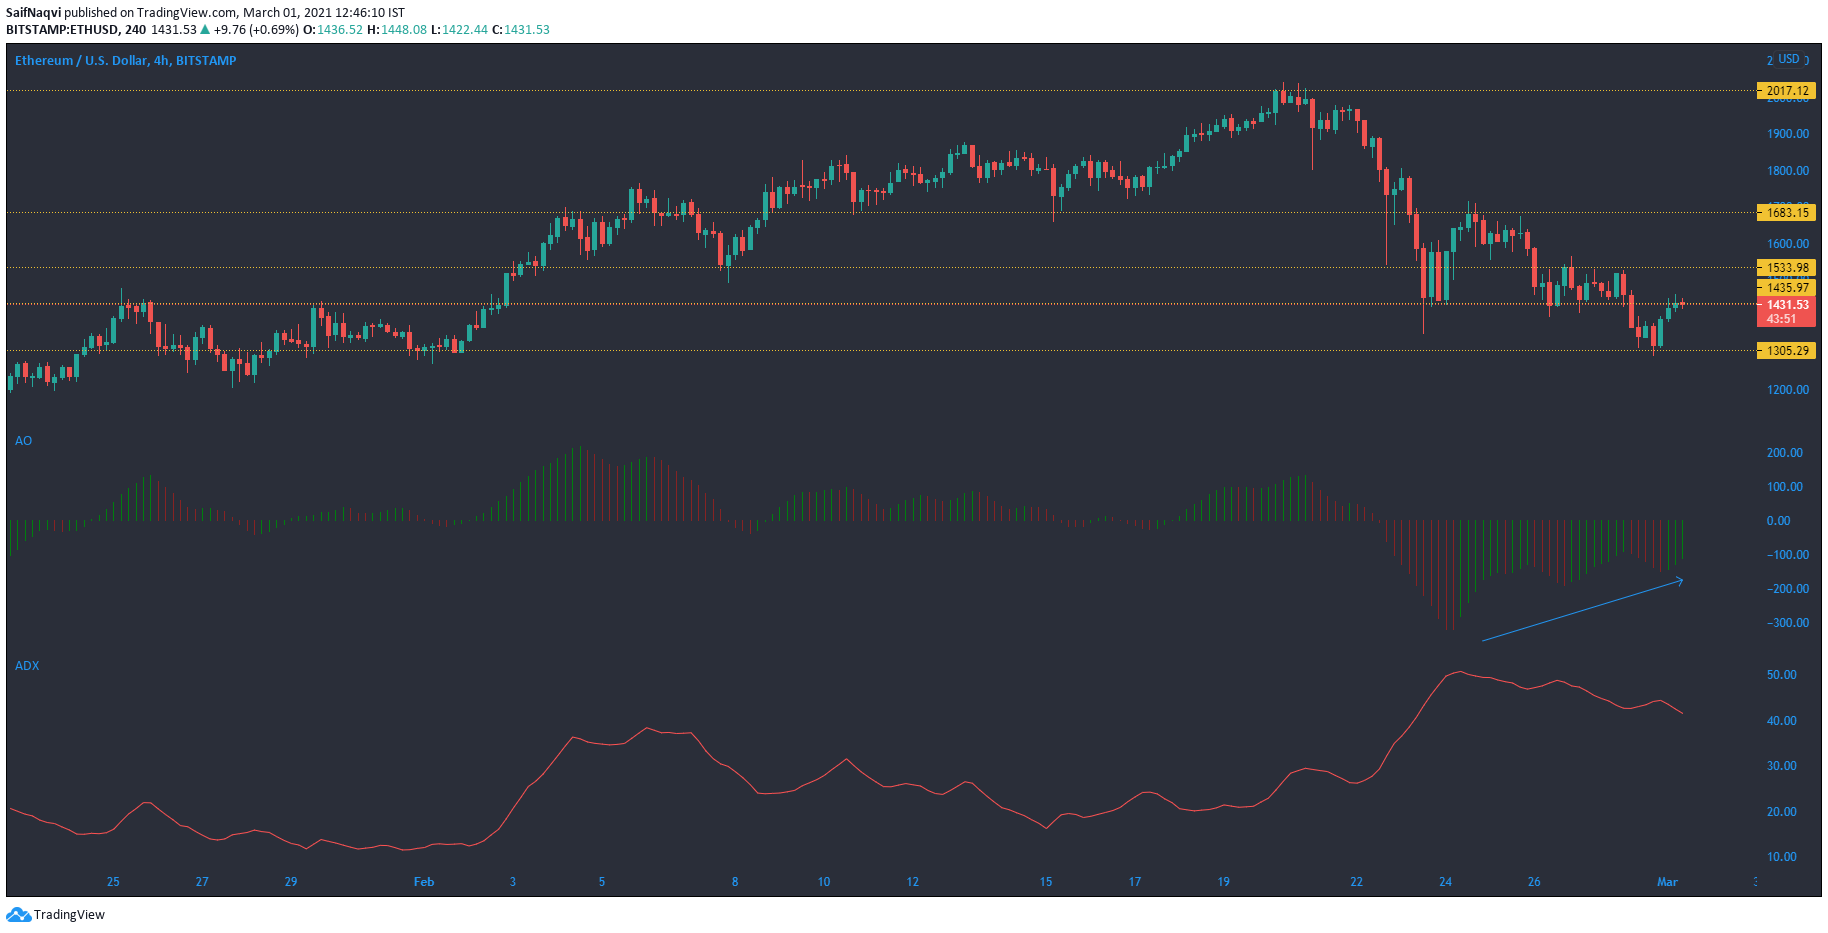
Source: ETH/USD, TradingView
Ethereum bounced off the $1,305 level and traded above the $1,400 mark at the time of writing after the price rose by over 4% in the last 24 hours. The ADX indicator pointed lower from the 40-mark, suggesting that the strong downtrend was losing steam. The Awesome Oscillator formed a bullish twin peak as momentum switched to the buying side over the last few sessions. The next overhead resistance resided at $1534.
However, gains on ETH could be capped at every price level considering the correctional phase in Bitcoin. What also remains to be seen is whether ETH would fall below the strong $1,300 support level if the king coin retraces further on the charts. While Ethereum’s correlation with BTC may be high, strong fundamentals back its overall price.
Bitcoin SV [BSV]
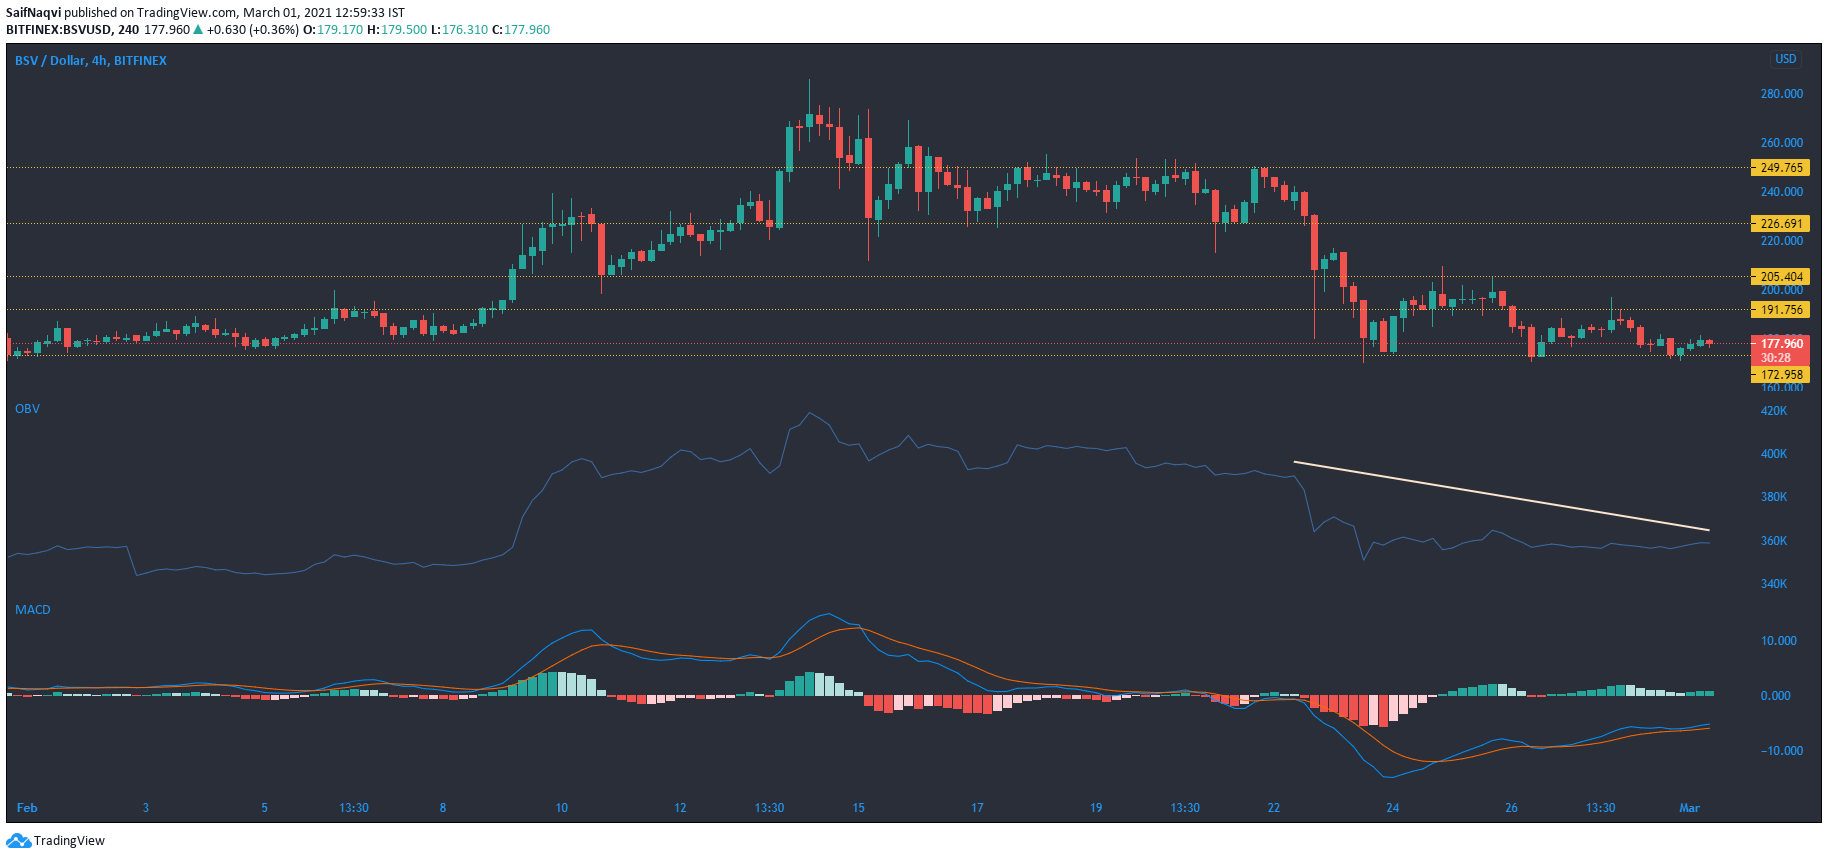
Source: BSV/USD, TradingView
Bitcoin SV maintained its price above the $172.9 level at press time and the bulls prevented a move lower on the charts. The On Balance Volume moved lower and highlighted BSV’s drop to $174 from $249, dragged by selling pressure. The MACD line floated just above the signal line and indicated some bullish presence in the market.
However, a move above the press time resistance was unlikely as the 24-hour trading volumes were on the weaker side. Expect BSV to trade within its immediate resistance and support moving forward.
VeChain [VET]
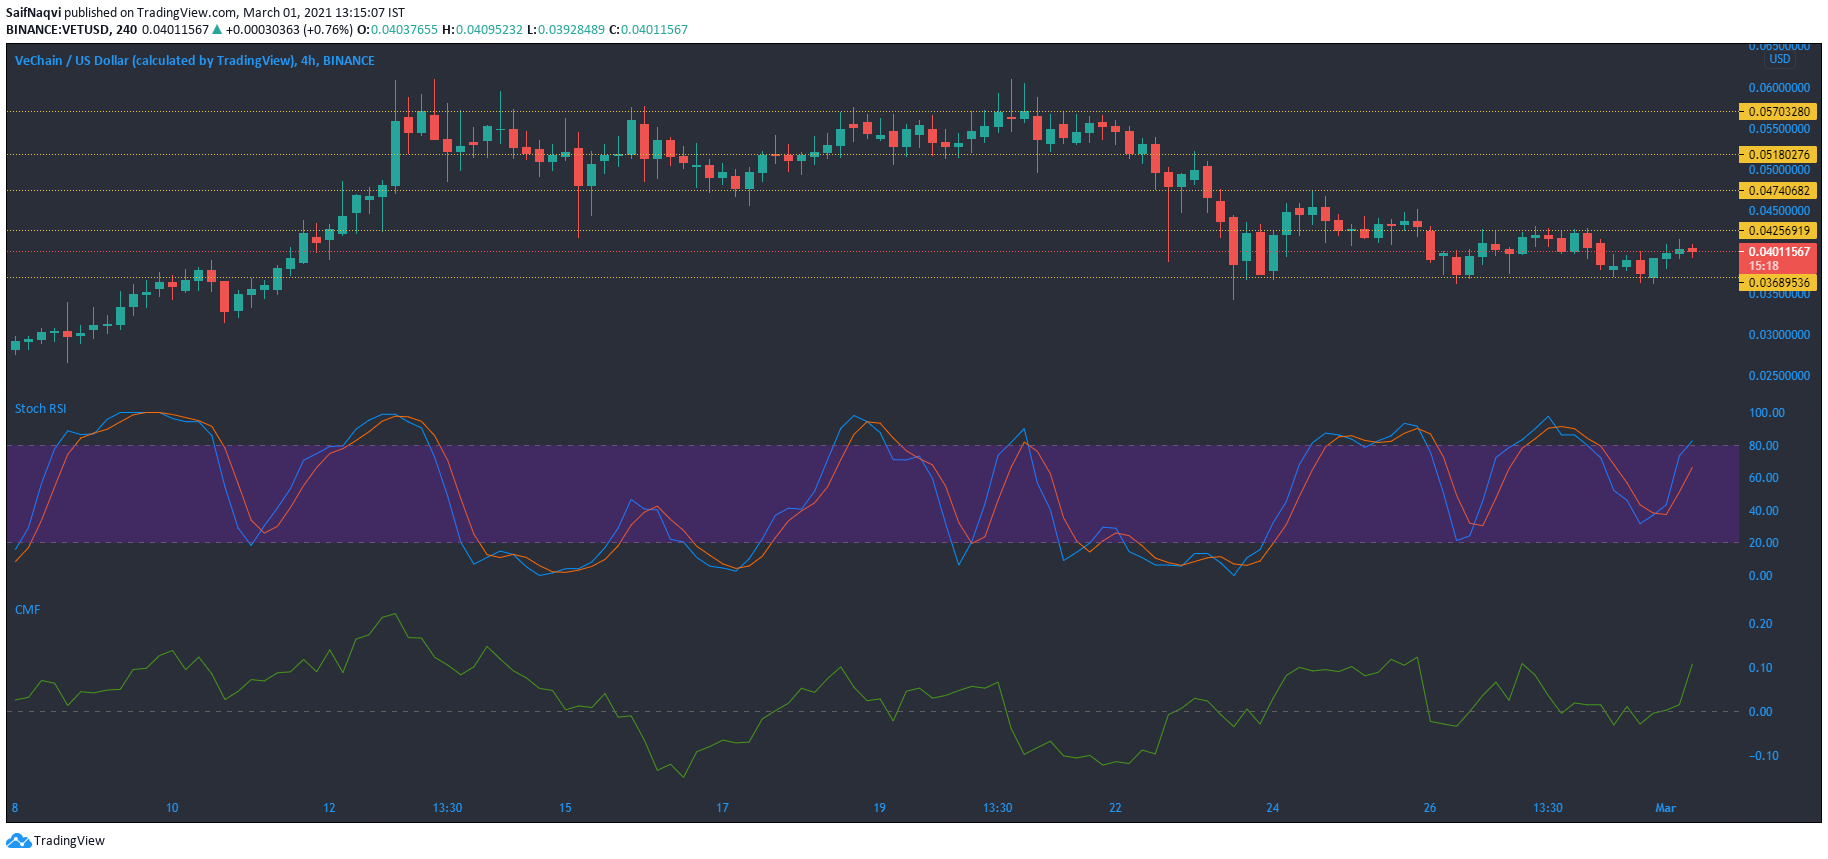
Source: VET/USD, TradingView
VeChain switched to green at the time of writing and traded at $0.040, up by 4% since yesterday. However, the appearance of a red candlestick after three consecutive green bars suggested that bearishness was still relevant in the market despite positive on-chain metrics.
The Stochastic RSI pointed towards the overbought region and indicated the bullish nature of VET. The Chaikin Money Flow rose sharply above the half-line and showed that capital inflows may have prevented VET from moving below $0.036 support. The inflows, however, may not be enough to warrant a move above $0.042 resistance as trading volumes were muted.