Ethereum bulls might help prices, but predictions show…
Two demand zones are identified for ETH - but a move toward $2900 may also be imminent.

- Ethereum showed strong bullish sentiment on the price charts.
- A retest of the range highs would provide an ideal buying opportunity.
Ethereum [ETH] saw a minor pullback from $2867 to $2719 from the 15th to the 17th of February.
This came after the strong breakout past the range highs at $2.6k, a level that the bulls struggled to breach over the past six weeks.
The steady rise in active addresses in recent weeks suggested that a long-term uptrend was beginning, but that does not rule out retracements.
Two demand zones were identified- but the data also suggested that a move toward $2900 was imminent.
Gauging the state of the market
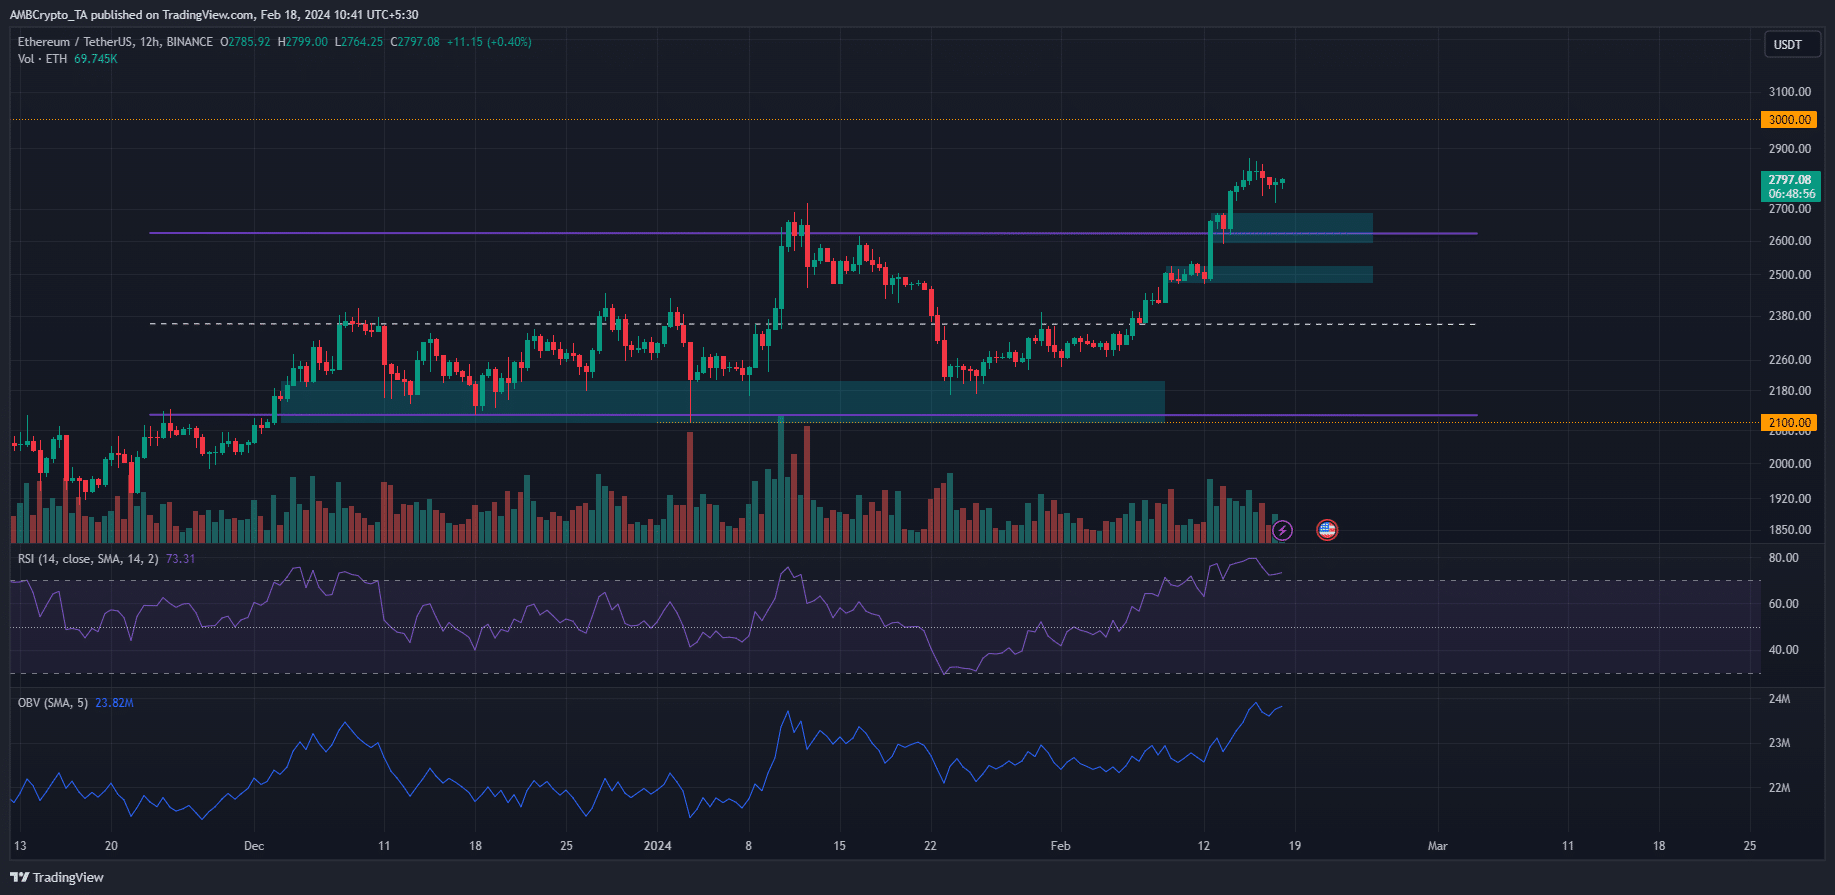
The H12 chart of Ethereum showed a clear uptrend in progress. The market structure was firmly bullish. A drop below $2472 would be required to flip the structure bearishly.
The RSI was at 73 at press time and has been within the overbought territory over the past six days.
This does not necessitate a deep pullback, but it does show that the prices were likely overextended and might need time to cool down.
Meanwhile, the OBV continued to rally higher as buying volume spurred it northward.
The steady demand and momentum indicated that it was only a matter of time before Ethereum prices climbed to $3000 and higher. Beyond $3k, the $3250 and $3580 levels were significant resistances.
Short sellers could face liquidations soon
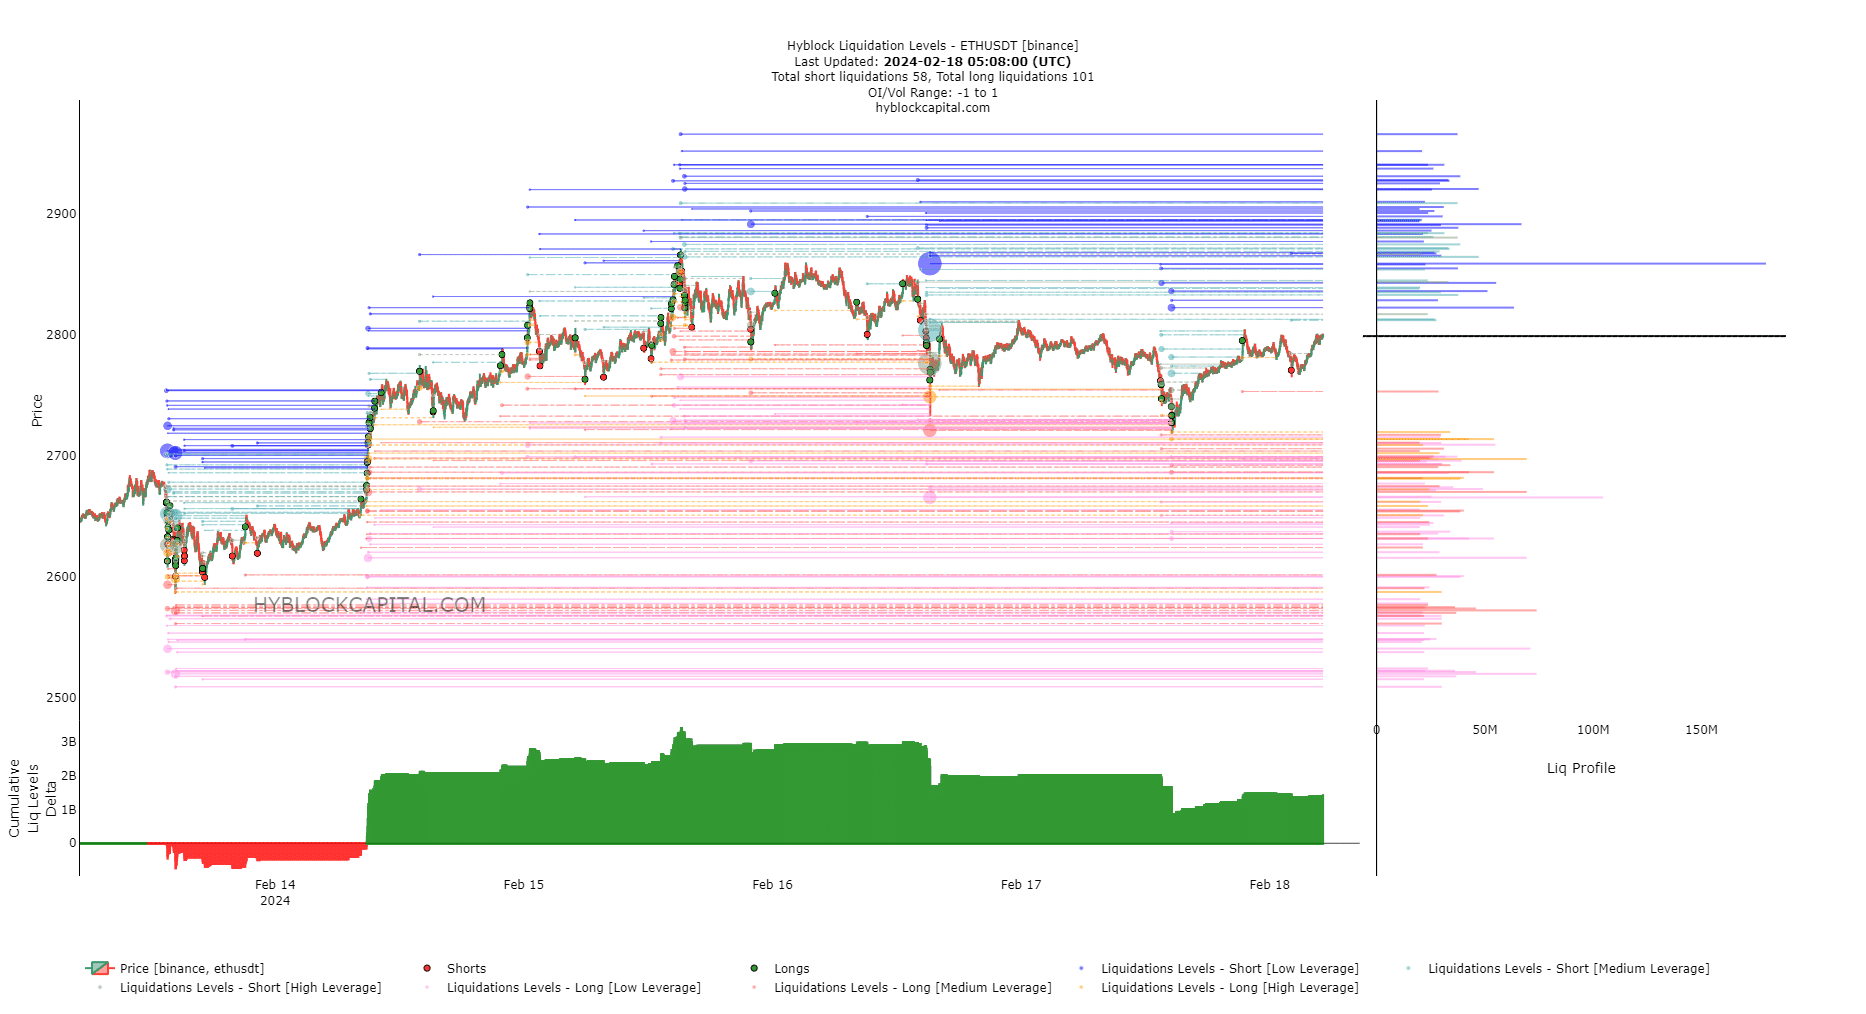
AMBCrypto also analyzed the liquidation levels data from Hyblock.
Notably, the Cumulative Liq Levels Delta remained positive despite the minor pullback over the past couple of days. This showed there were more long liquidation levels.
How much are 1,10,100 ETHs worth today?
However, their liquidation clusters were at $2550 and just below the $2700 mark. Meanwhile, a $179 million short liquidation level was present at $2858 (blue).
Hence, a move to the $2850-$2900 region was likely. It could be followed by another move higher, as the long liquidations, while more numerous, were more spread out.
Disclaimer: The information presented does not constitute financial, investment, trading, or other types of advice and is solely the writer’s opinion.