Ethereum: Can a retracement to $3.7K propel ETH’s price to $4000?
Most Ethereum metrics hinted at a price correction in the near future.

- Etherium to retrace to $3.7k to retest a support zone before a price surge to $4k.
- Most metrics hinted at a price correction in the near future.
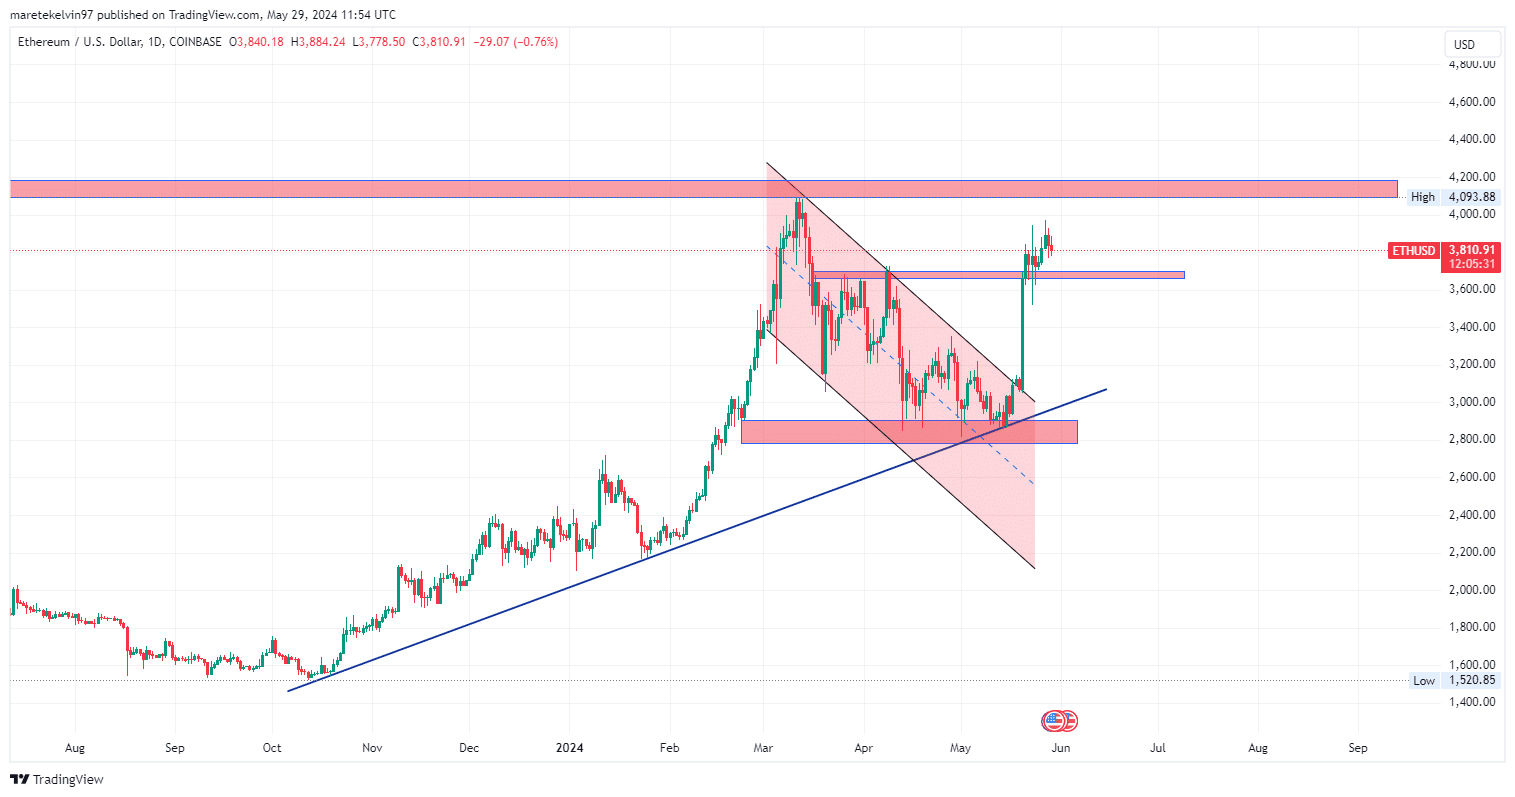
Ethereum [ETH] is retracing to $3.7k, the resistance zone that turned to support before retesting to surge to a target high of $4k. This support zone could lead to a surge towards the target high of $4k.
However, the fair value gap below $3.7k might act like a price magnet, pulling the price lower and potentially breaking this support. If the bearish momentum pulls the price past the support zone a retest at the upward trendline support is likely.
As of writing, CoinMarketCap data shows a 2.24% decrease in price over the last 24 hours and a 2.16% increase over the last 7 days. The overall Ethereum performance is on a bullish move as investors keep eyes on the $3.7k support level.
Is a bullish surge to $4k possible after the retracement?
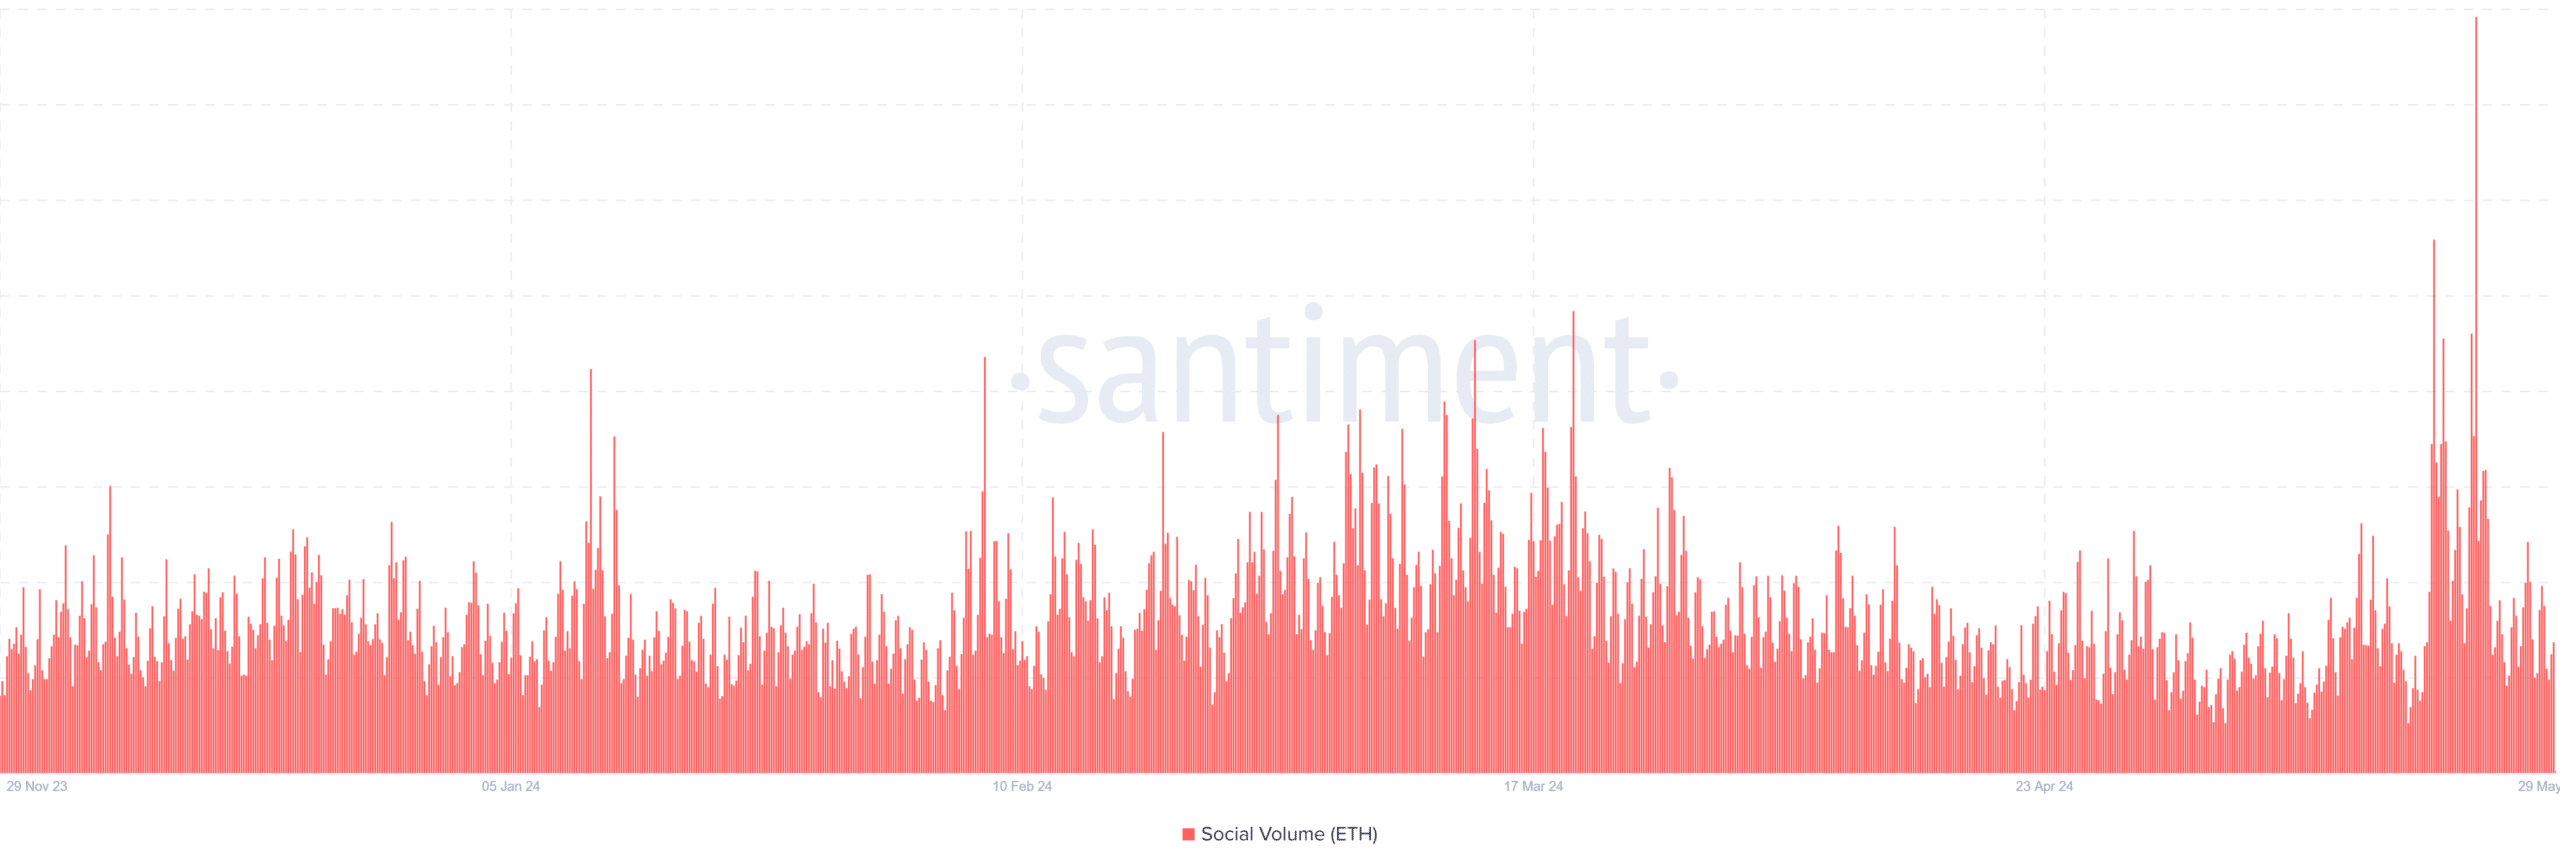
AMBCrypto analysed Santiment’s Social Volume chart, it showed several periodic spikes in the mid-May, correlating with significant price movements. The retracement to 3.7k aligns with increased social activity indicating a potential price direction.
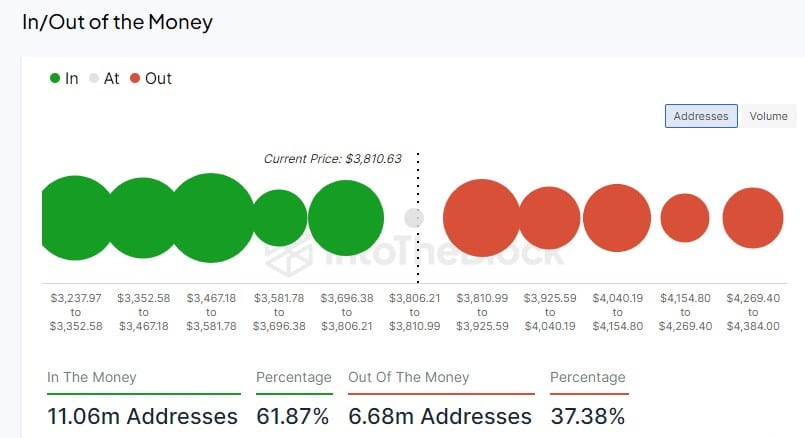
AMBCrypto further analysed the IntotheBlock In/Oot of the Money chart and it indicated that 61.87% of addresses valued at $11.06 million are in profit while 37.38% of addresses valued at $6.68M are at a loss.
Additionally, it indicated that 135k addresses are breaking even. It showed that the key prices ranges from $3.3K to 3.6K in profits and $3.9 to $4k in losses.This distribution indicates a significant support and resistance levels based on the holders profitability.
Is your portfolio green? Check out the ETH Profit Calculator
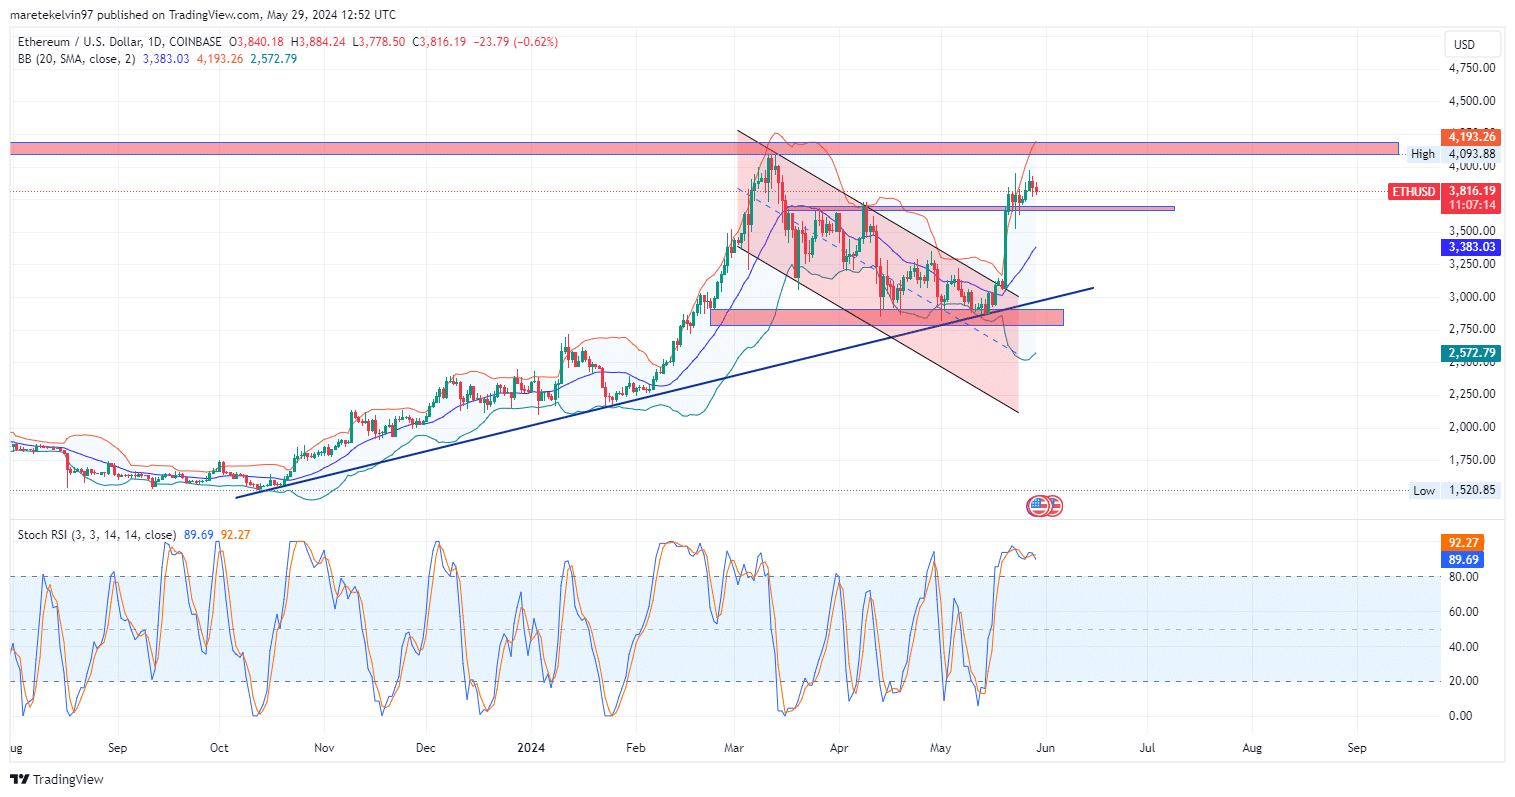
The Bollinger bands in the daily chart widened, indicating a high volatile market that could steer a slight bearish pressure to the support zone at around $3.7k and break out to surge to $4k target.
The stochastic RSI (89.69) shows an overbought reading suggesting a short term retracement before continuation of the overall bull run.