Ethereum Classic, EOS, VeChain Price Analysis: 29 May

Ethereum Classic could revisit its mid-April levels of $25-26 in a bearish outcome. EOS was in danger of a 17% plunge in case of a rising wedge breakdown. Finally, VeChain was trading within an ascending triangle, but a breakout could take place in either direction.
Ethereum Classic [ETC]
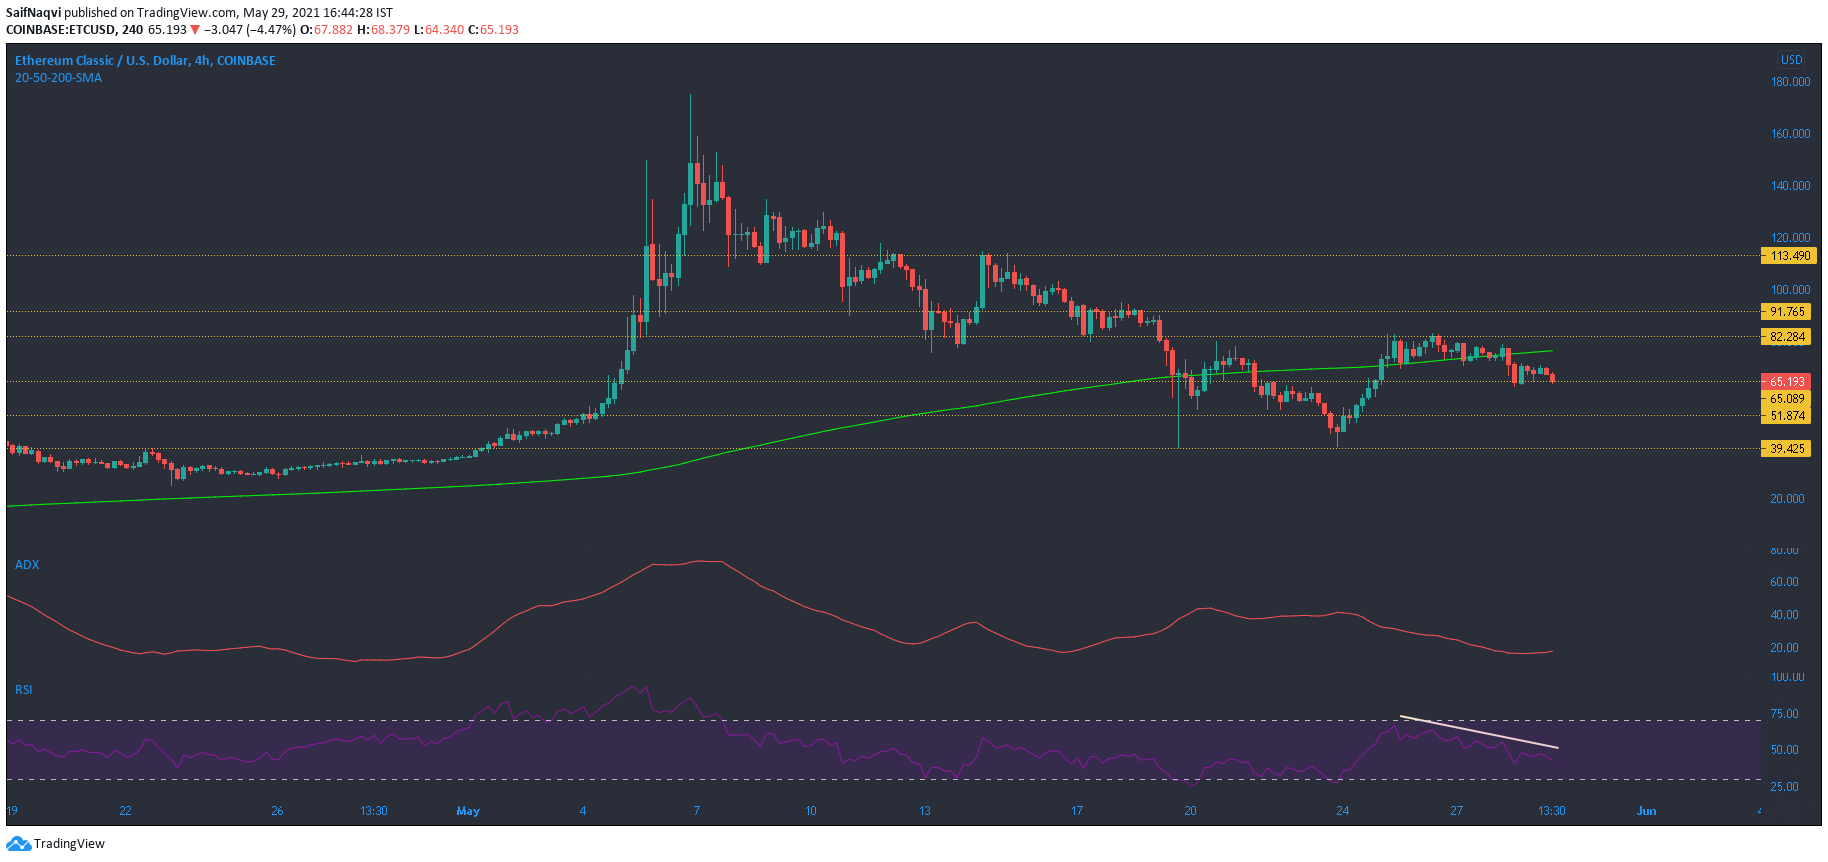
From 25-29 May, Ethereum Classic’s ADX has been on a steady line. As the market has become less and less directional, ETC’s jump from $39 to $83 lacked the conviction to extend its rally. Therefore, it was hardly a surprise when ETC failed to break above its upper ceiling and post sharper gains. Since volatility was low in the market, ETC was not expected to register large price swings over the coming sessions.
In case of a breakdown below $39.4, ETC would likely move towards its mid-April levels of $25-26. After bouncing back from the oversold zone, the RSI switched to a downtrend once again and indicated weakening momentum.
EOS
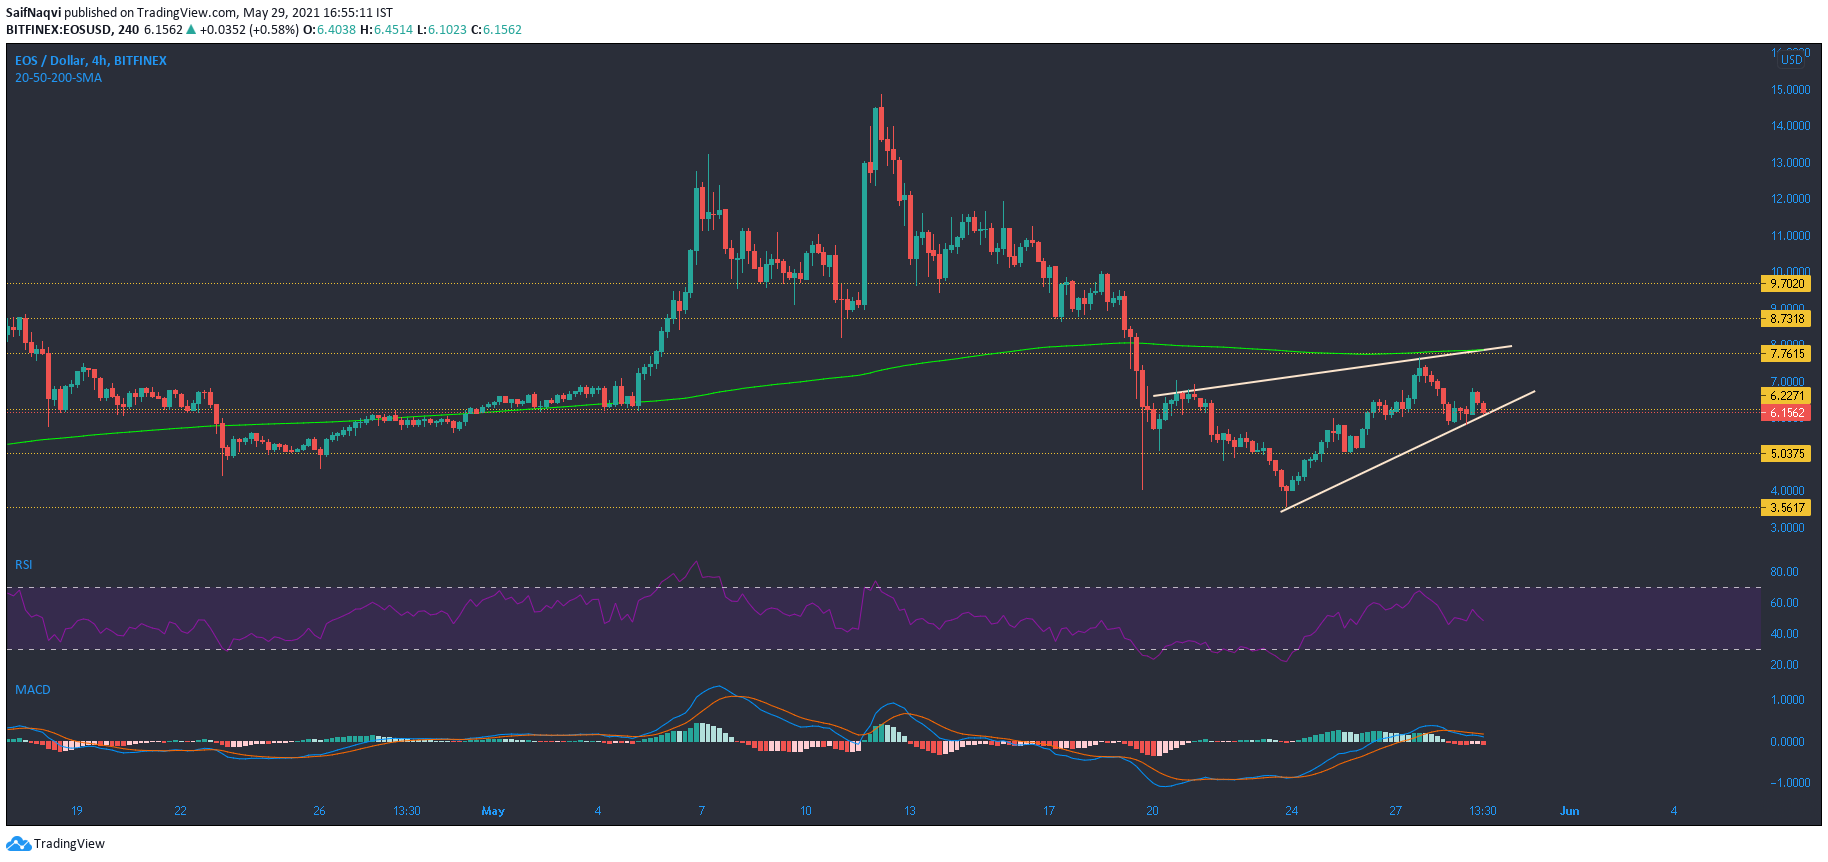
A rising wedge pattern was spotted on EOS’s 4-hour chart and its price was on the precipice of a pullback. A drop below the lower trendline could result in a 17% retracement towards $5.03. On the other hand, a hike above $7.76 and 200-SMA (green) would nullify this bearish formation. If the RSI maintains its path towards the oversold region, the chances of a breakdown would be heightened.
On the other hand, the MACD line was still above the half-line while its histogram noted bullish-neutral momentum. Further consolidation within its pattern was also an option, but the threat of a breakdown would still be present.
VeChain [VET]
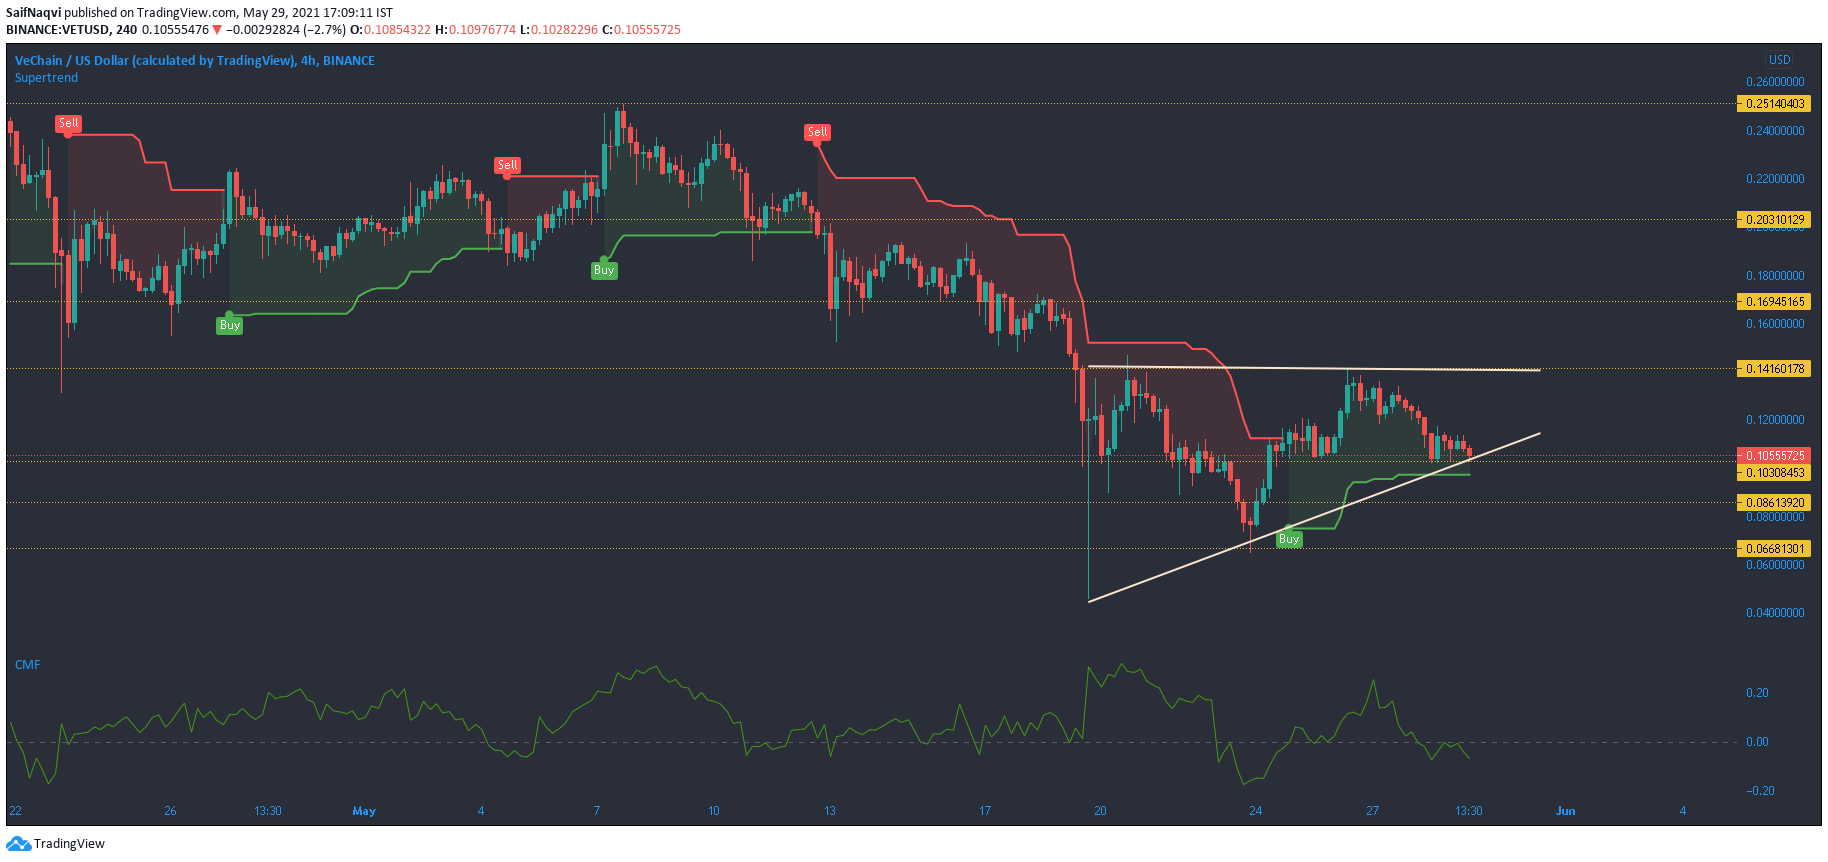
VeChain traded close to the $0.103 support, at the time of writing, and presented a few possibilities for its short-term trajectory. On the 4-hour chart, VET formed an ascending triangle and while this generally sees a break to the upside, broader market cues would likely dictate the direction of a breakout. A drop below the press time support could drag VET by 15% to $0.086. A sharper loss could take the price towards $0.066. Conversely, a rise above the upper trendline would result in a 20% hike at $0.142-resistance.
Supertrend Indicator flashed a buy signal at the said price but placed a stop-loss at $0.097- slightly below the bottom trendline. Another bearish sign was presented by the CMF as capital outflows outweighed inflows during press time.


