Ethereum Classic: How long should you continue HODLing during this crypto winter

Disclaimer: The findings of the following analysis are the sole opinions of the writer and should not be considered investment advice.
- Ethereum Classic continued to consistently crawl down while the broader sentiment deteriorated.
- The crypto’s social dominance plunged over the last two days.
Ethereum Classic [ETC] sellers inflicted a relatively unhindered bearish pull over the past three months. The ongoing surge in selling pressure led the price to dip toward its vital support zone in the $21-$22 range.
Read Ethereum Classic’s Price Prediction 2023-24
The bearish pullbacks positioned ETC in a south-looking channel while keeping the long-term recovery hopes alive. However, the near-term market structure formulated a rather conducive environment for the sellers.
At press time, the alt traded at $20.41, down by 11.23% in the last 24 hours.
Do the buyers have any near-term comeback prospects?
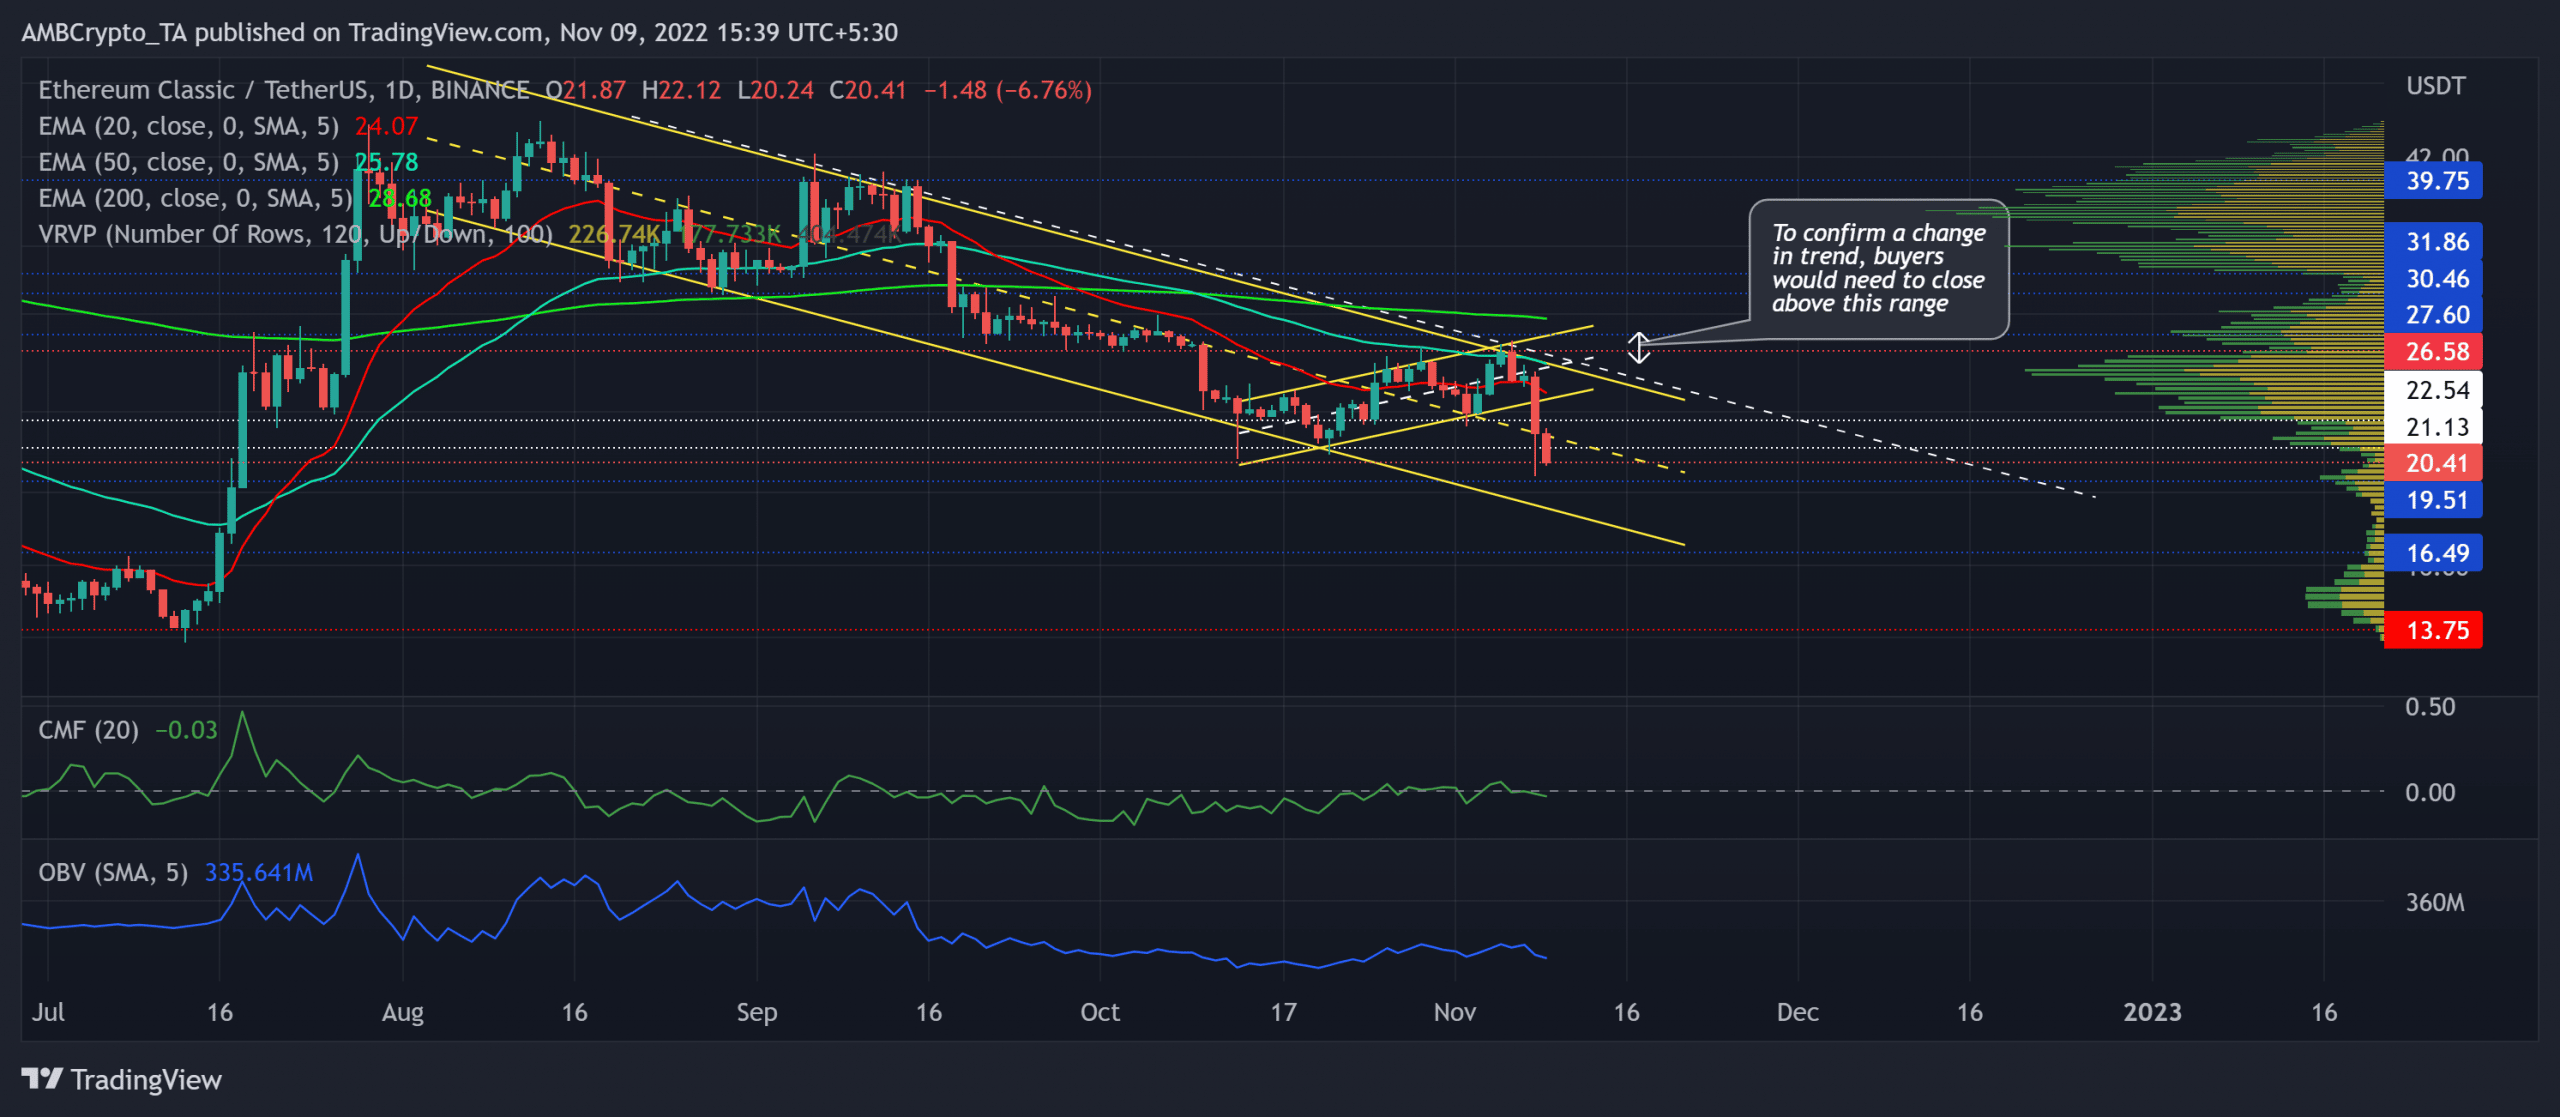
ETC’s decline phase kept snowballing after marking consistent reversals from the upper trendline of its descending channel (yellow). For over three months, the buyers have exhibited their willingness to bounce back from the $21.1 support mark.
A close below this mark could likely open doorways for an accelerated decline toward the lower trendline of the down channel.
Although ETC lost over half its value in its current patterned oscillation, the altcoin did not mark a substantially volatile phase on the daily chart. As a result, the price action kept strolling near the 20/50 EMA.
Going forward, a sustained close below the $21-mark level can position the coin for an immediate downside in the coming sessions. This decline would pull ETC toward its less liquidity range, as evidenced by the visible range profile.
Any decline below the boundary of the current pattern would hint at a one-sided bearish edge. The first major support level, in this case, would lie in the $16.5 region, followed by the $13.75 baseline.
If the broader sentiment marks any improvements, ETC buyers could enter into an accumulation phase. In these circumstances, the buyers could continue facing barriers near the upper trendline of the down channel in the $26-$27 range.
The Chaikin Money Flow (CMF) and On-Balance-Volume (OBV) marked a streak of higher troughs over the last few days while bullishly diverging with the price action. But the CMF still needed to find a convincing close above the zero mark to affirm a buying edge.
ETC’s Social Dominance hinted this
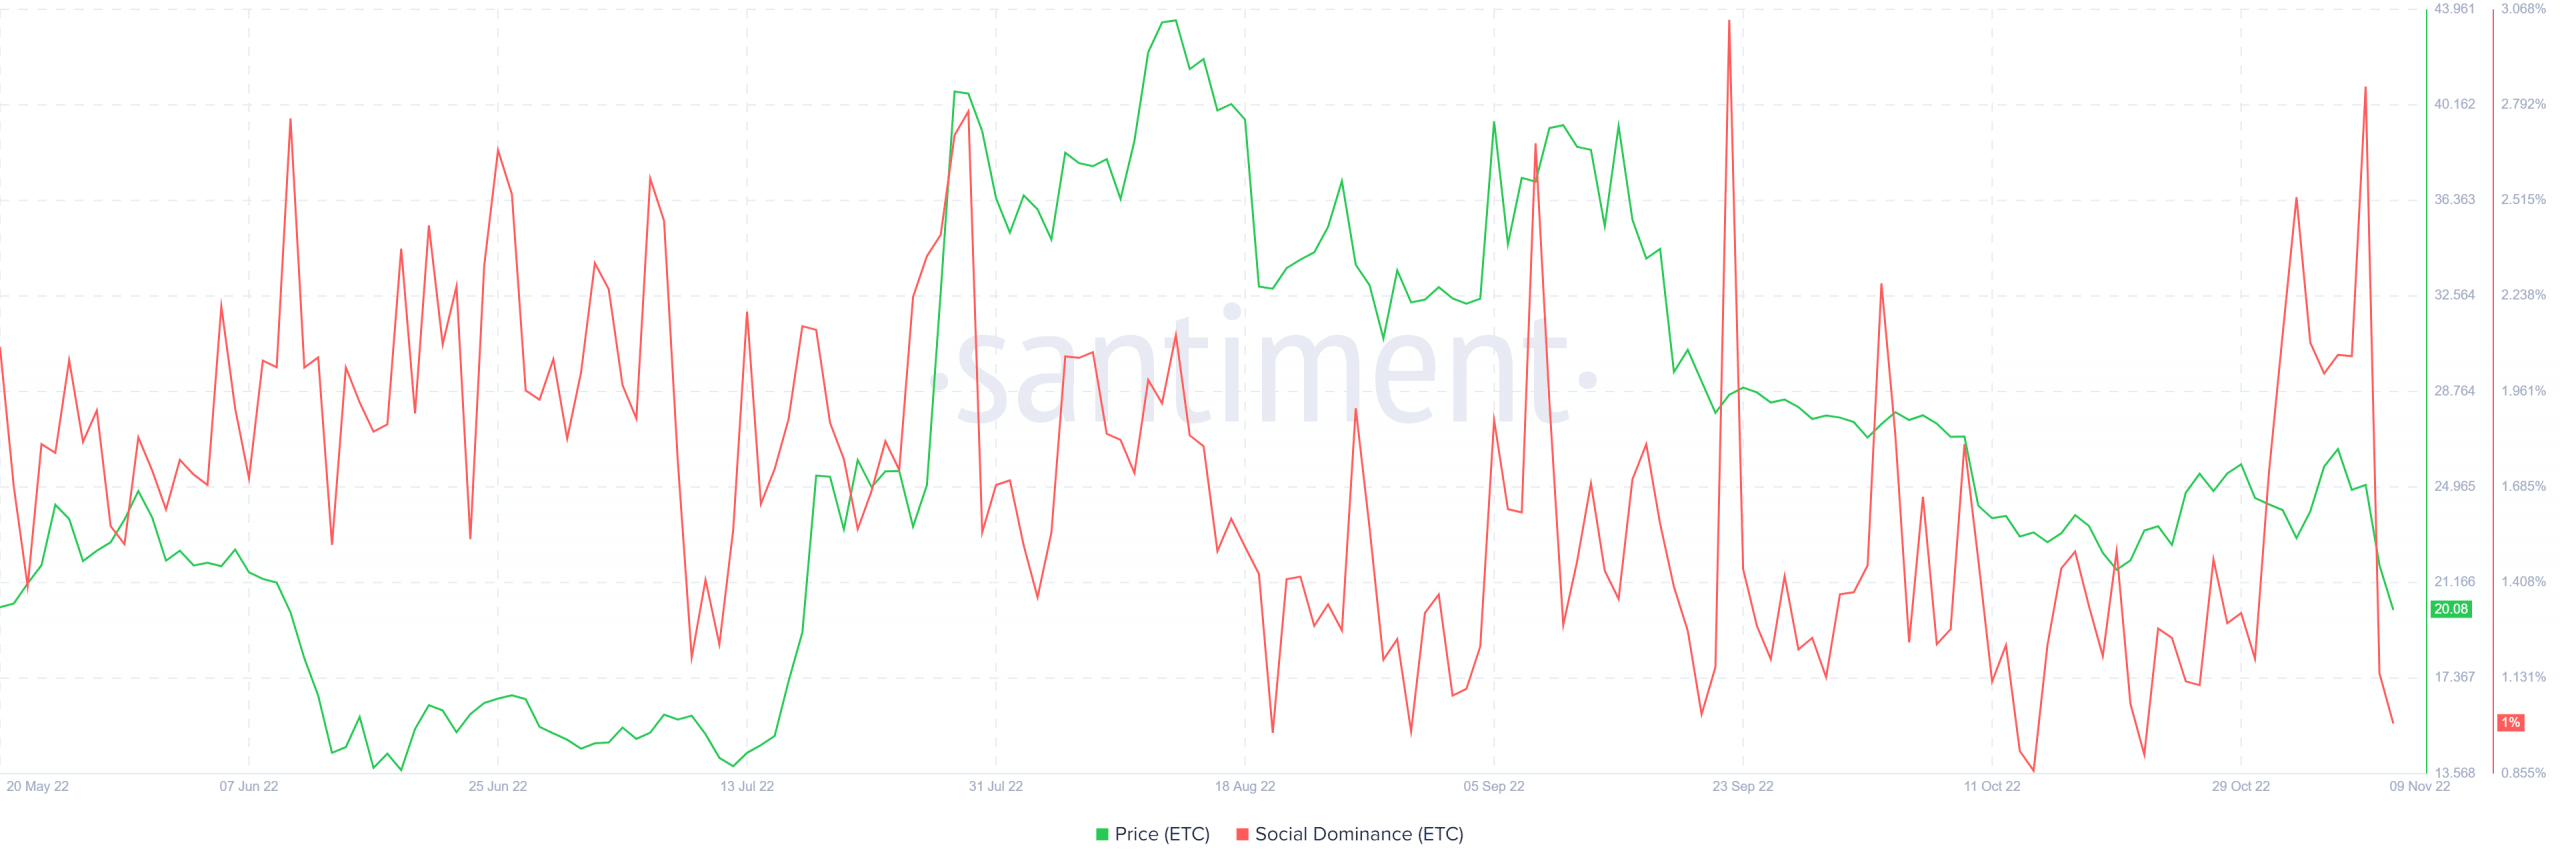
While the price action has been on a consistent slump since mid-August, ETC’s social dominance revealed mixed signals. Empirically, ETC has exhibited a relatively high correlation to this metric on a daily basis.
The long-term price plunge entailed a decline in social dominance as well. But ETC marked a substantial peak in its dominance during the first week of November. The price action is yet to react to this spike. Nonetheless, the metric also marked a plunge over the past day.
Buyers should keep a close eye on Bitcoin’s movement to gauge any improvement potential on this metric. More importantly, the broader market sentiment and other on-chain developments could be vital in influencing future movements.