Ethereum Classic: Mapping out the after-effects of >17% 24h loss

Disclaimer: The findings of the following analysis are the sole opinions of the writer and should not be considered investment advice.
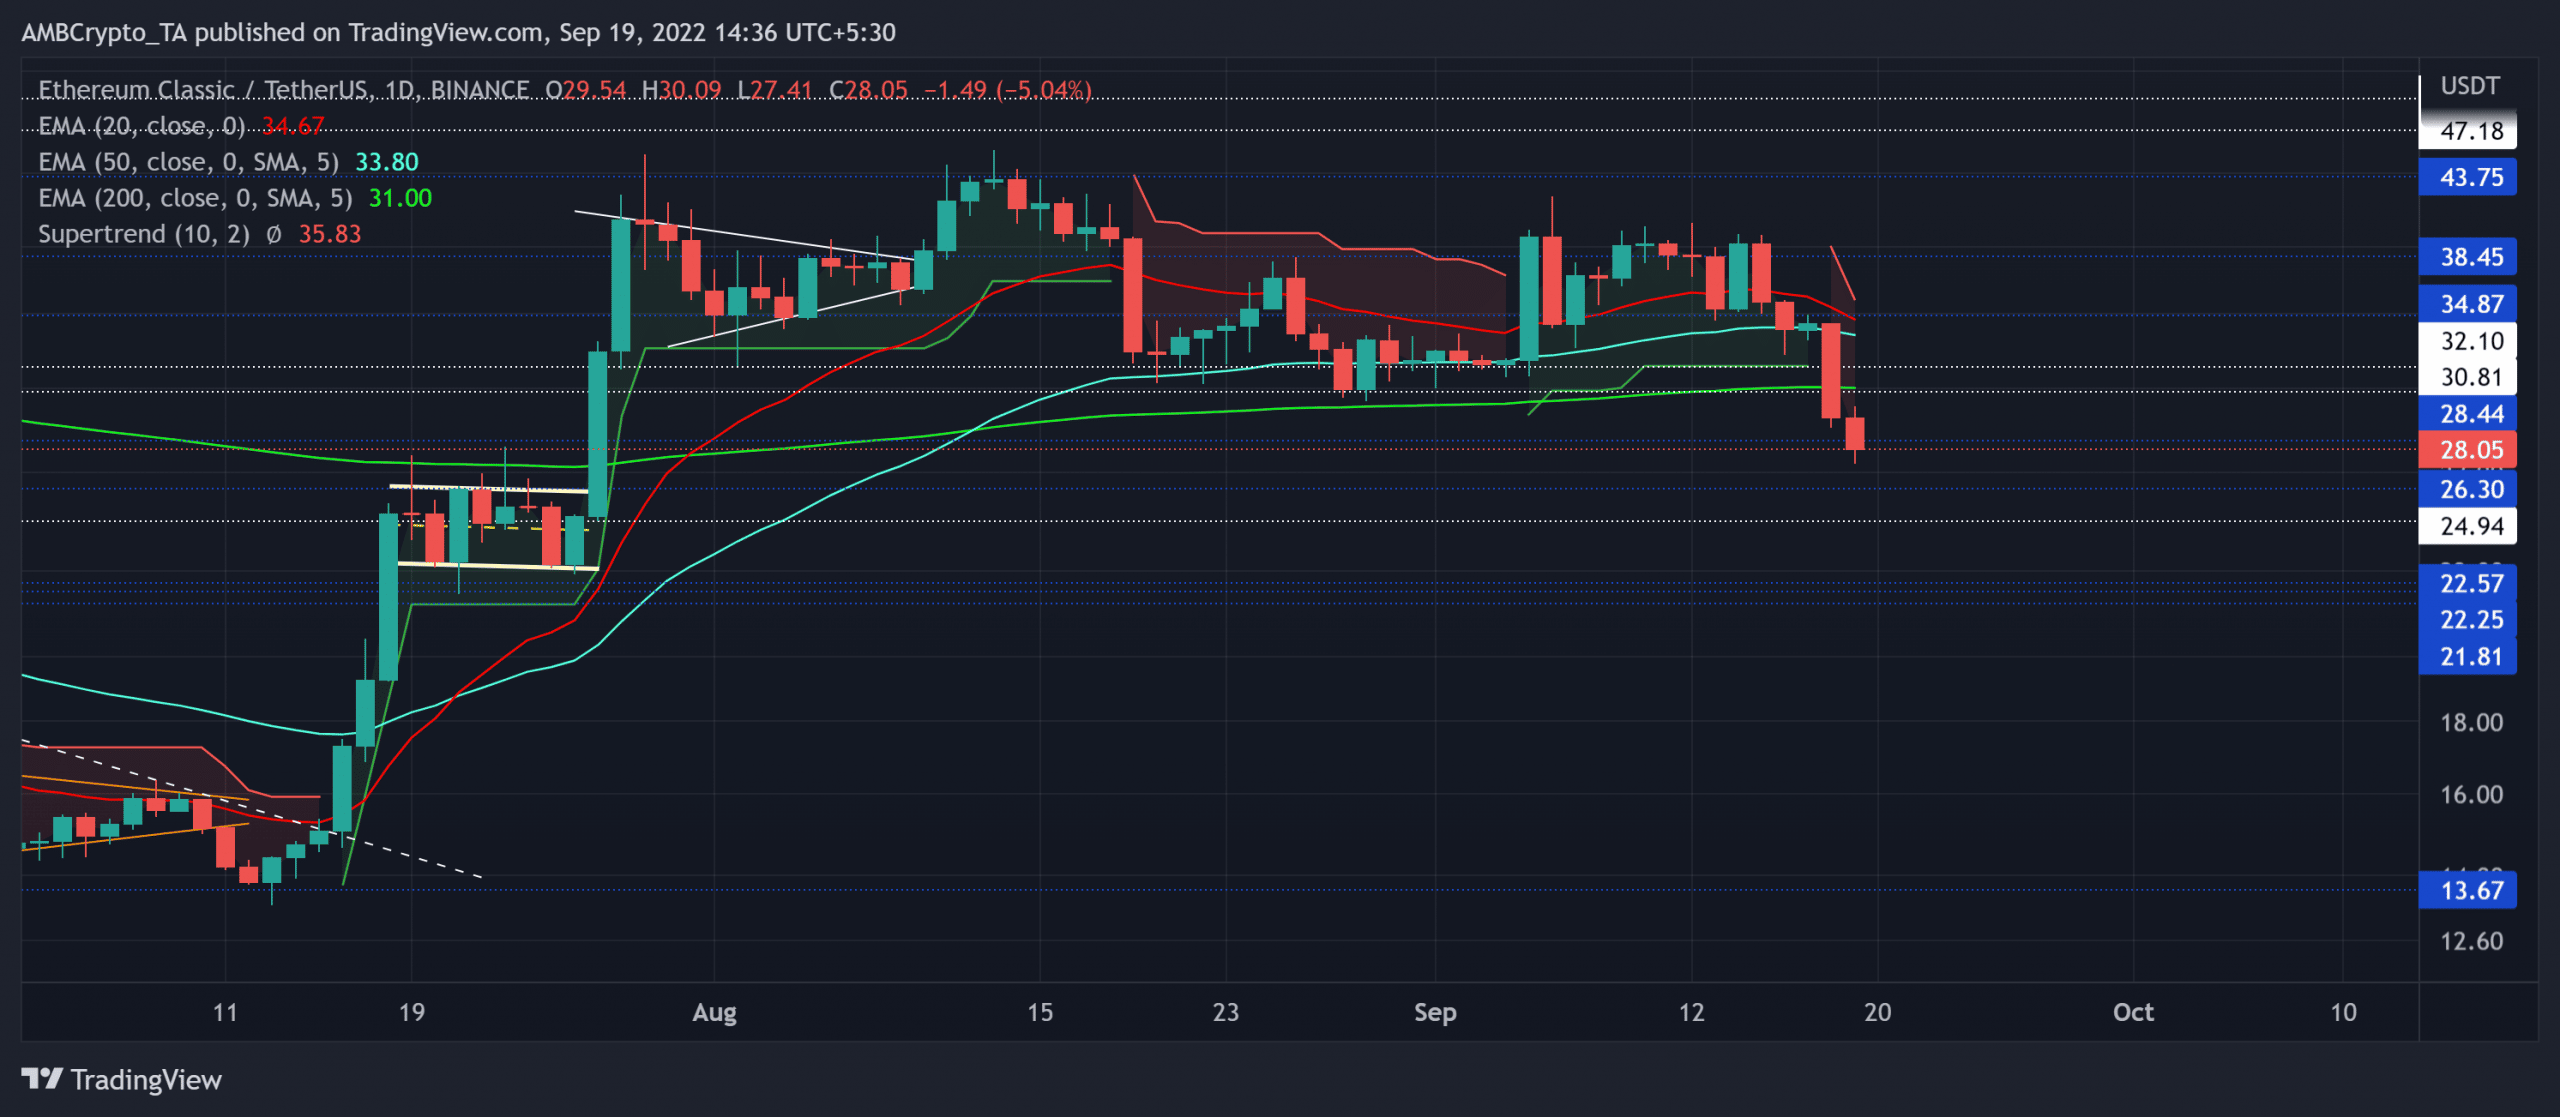
Over the last two months, Ethereum Classic [ETC] saw a choppy movement as it compressed in the $30-$43 range. After bagging impressive gains in its previous rally, the bears seemed to re-enter the market with the coin losing its $30 baseline support.
ETC fell below the daily 20/50/200 EMA in the last few days to depict a strong selling edge. Its current southbound journey could continue testing fresher lows until the buyers step in to inflate the buying volumes. At press time, the alt traded at $28.05, down by a staggering 17.22% in just the last 24 hours.
ETC Daily Chart
ETC’s recent reversal from the $38 resistance put it back into the bearish track as it descended below its EMAs. The coin shed nearly 30% of its value over the last four days.
This decline pulled ETC below the vital $30-$32 range as it glided south past its high liquidity zone. With the 20 EMA (red) looking south, a bearish crossover with 50/200 EMA would further reaffirm the increasing selling vigor.
Additionally, the Supertrend changed its stance to reflect a sell signal as it turned red on 18 September. A sustained sway below the $28.4-level would likely propel a continued slowdown. In this case, the buyers can expect a near-term rebound from the $24-$26 range in the coming sessions.
An inability of the 20 EMA to decline below the 50 EMA can aid the buyers in preventing an extended bloodbath. In these circumstances, the buyers would look to reclaim the crucial $32-level.
Rationale
The Relative Strength Index (RSI) hovered below the 40-region to reflect a robust selling edge. A continued decline can plateau in the oversold region before a plausible reversal.
Also, the MACD line (blue) plunged below the zero mark to resonate with RSI’s bearish readings. Should the Signal line (orange) fall below the equilibrium, it would reaffirm the press time bearish bias. Nevertheless, the ADX displayed a weak directional trend for the alt.
Conclusion
ETC’s bearish break below the EMAs has set a favorable space for the bears. A near-term pullback could find rebounding opportunities from the above targets.
Moreover, the broader market sentiment and the on-chain developments would play a vital role in influencing future movements. This analysis is critical to identify any bearish invalidations.


