Ethereum Classic: These levels could be the demand zone next week

Disclaimer: The findings of the following analysis are the sole opinions of the writer and should not be considered investment advice.
Like many altcoins in the crypto sphere, Ethereum Classic [ETC] has also been on a long-term downtrend on the charts. In February and March, the price did in fact break the long-term bearish market structure by climbing to the $52 highs. However, the beginning of April saw the altcoin diving lower on the charts. This was aided by Bitcoin [BTC]’s descent from the $47k resistance levels as well.
ETC- 12-Hour Chart
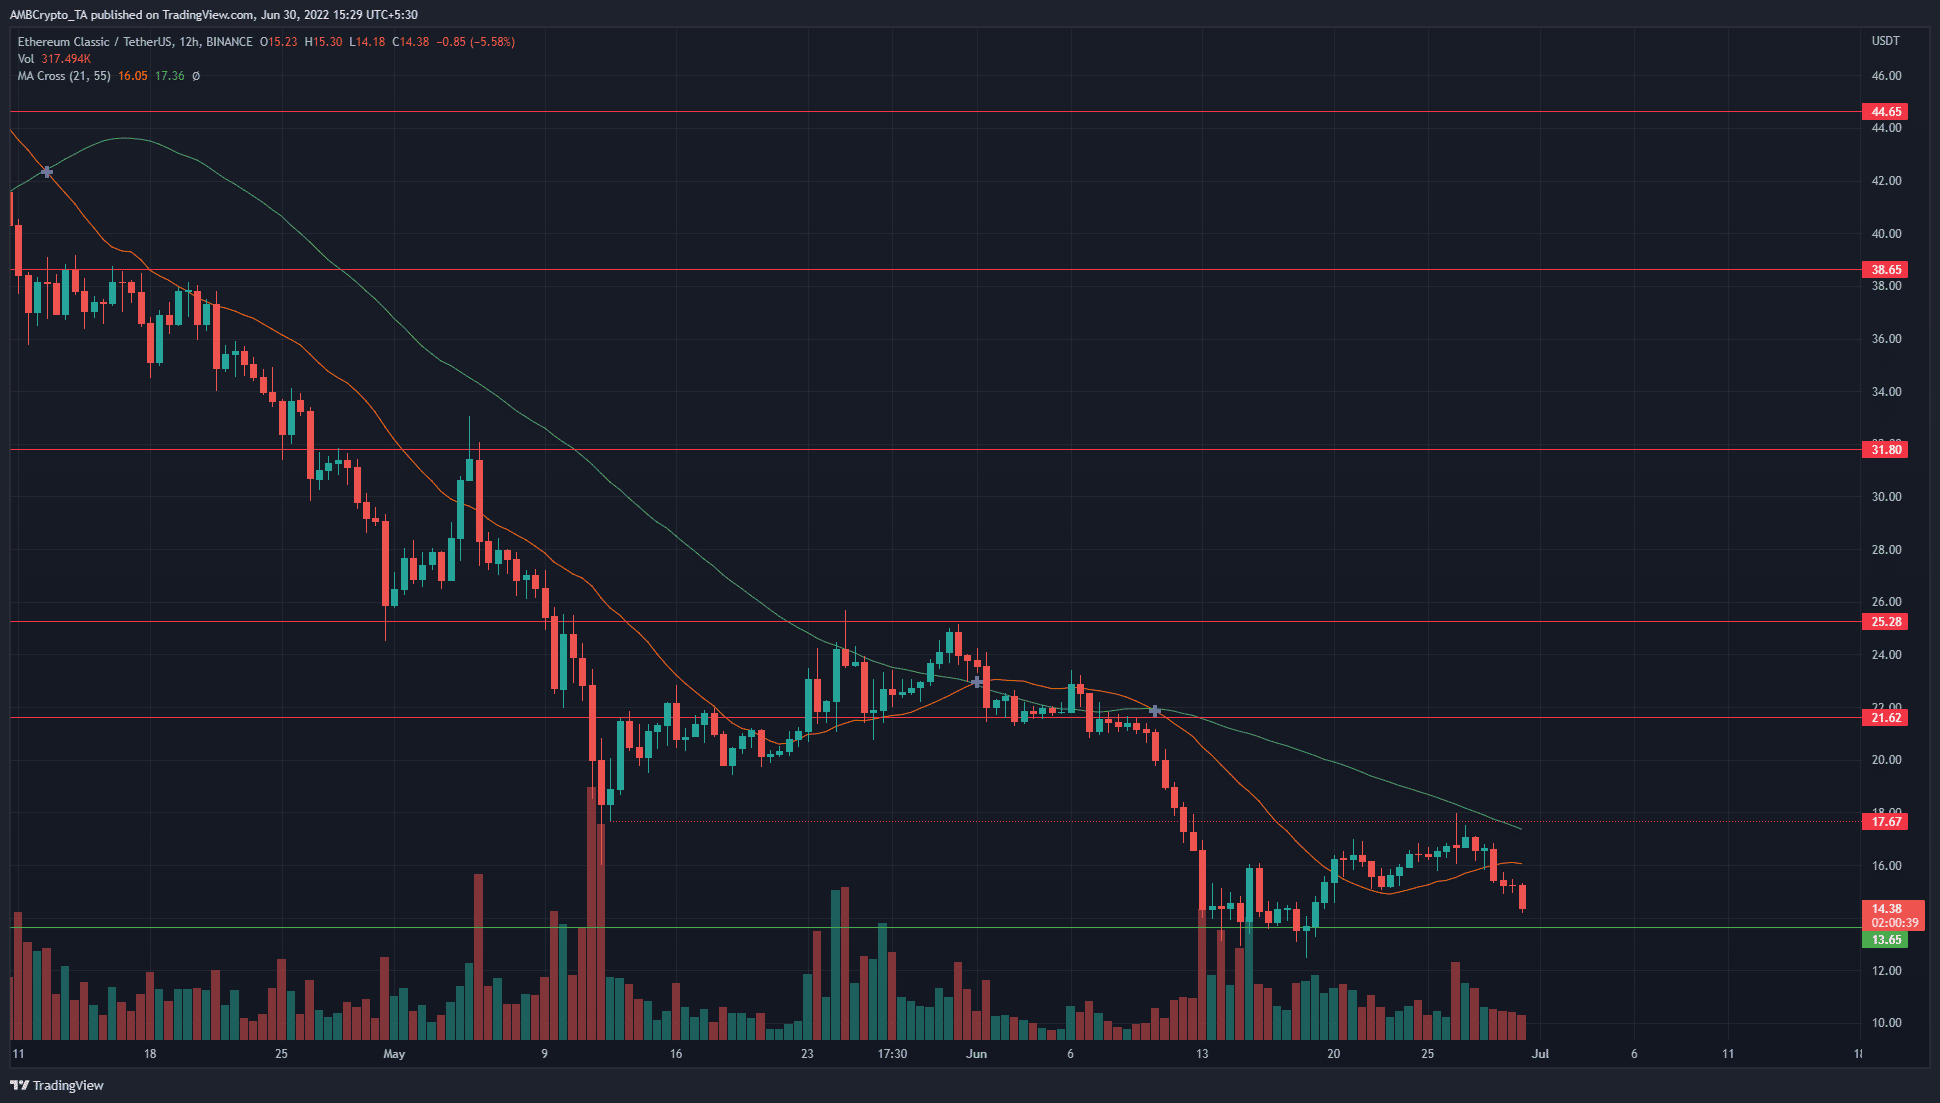
On 12 May, ETC dropped from $20 to $16 and managed to bounce to $21 on 13 May. This highlighted the entire area between $16-$18 as a strong demand zone. From this zone, ETC was able to see a large bounce.
Toward the end of May, the price was able to advance as high as the $25.3 resistance level. Yet, this rally did not signal a reversal in trend. Rather, it served to add fuel to the bearish fires. A week into June, the $21.6 support level was tested and soon gave way.
The price made a series of lower highs in recent weeks and has made another one at the $17.7 area. Thus, it confirmed the $16-$18 area as a resistance zone and pointed toward a further downside. The 21-period SMA (orange) formed a bearish crossover beneath the 55-period SMA (green) a couple of weeks ago, to highlight the bearish momentum further.
Rationale
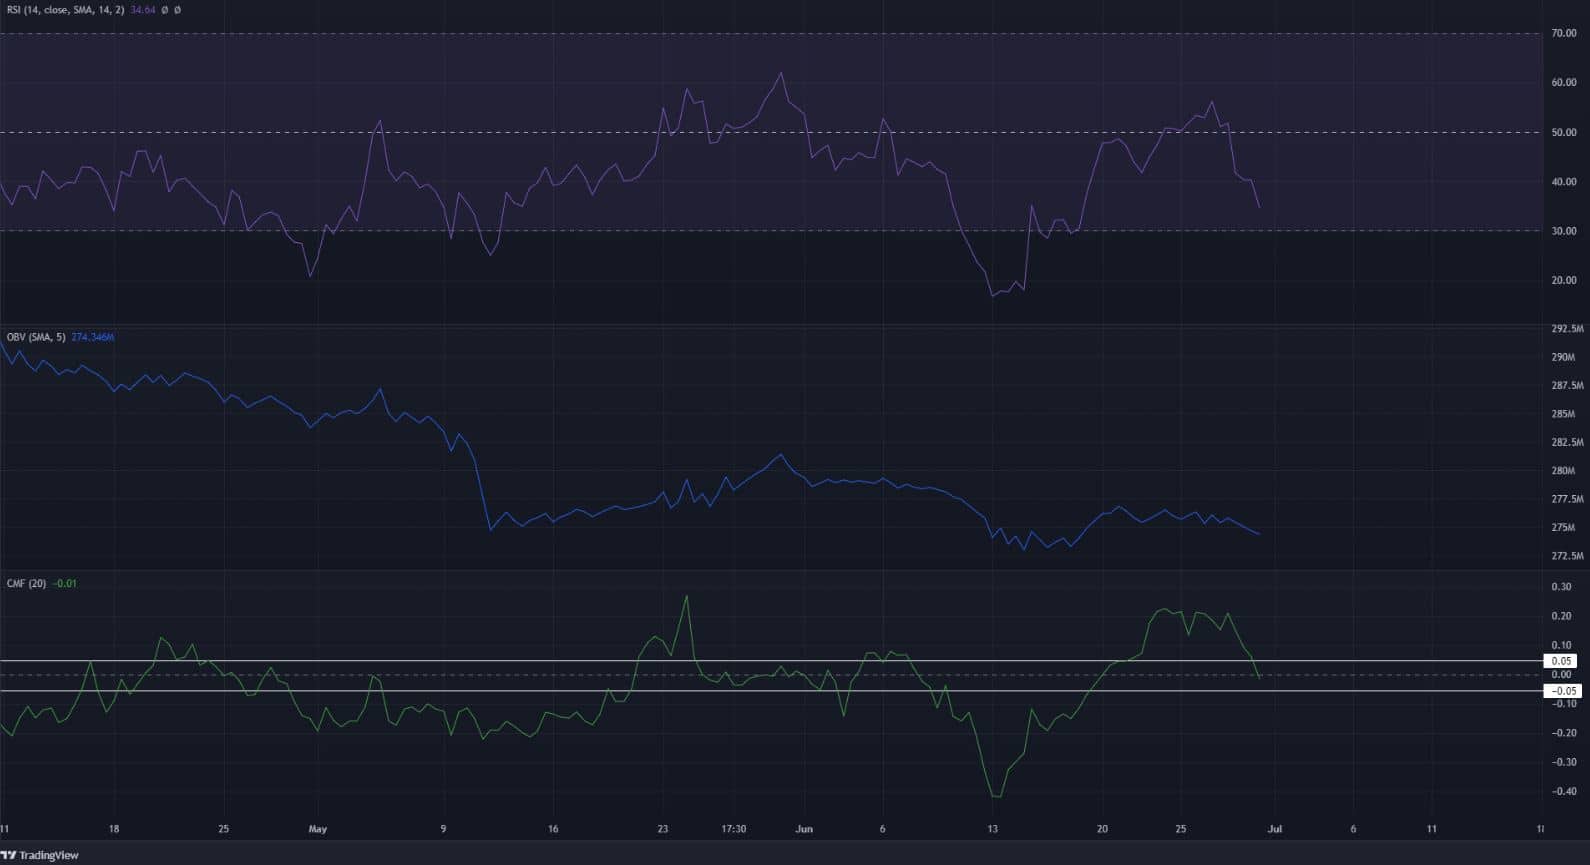
The Relative Strength Index (RSI) on the 12-hour chart has struggled to stay above the neutral 50. In the past two months, every foray above this level was an unenthusiastic adventure. The RSI was far more inclined to go southward. This suggested a bearish trend was dominant in recent months.
The On-Balance Volume (OBV) also found it hard to push higher and has slowly slipped lower to make a series of lower highs like the price. This indicated high selling volume and a lack of strong demand to reverse the downtrend.
The Chaikin Money Flow (CMF) has been above the +0.05 mark in recent days to show the influx of significant capital into the market. However, it too turned southward as of 29 June.
Conclusion
Considering Ethereum Classic’s scenario on the price charts, another push downward appeared likely. The selling pressure was mounting once more, and the momentum remained bearish on the higher timeframes. The $13.6 and $10.4 could be tested as support levels over the next few weeks.