Ethereum Classic: Why long-term prospects of ETC are on brighter side

Disclaimer: The information presented does not constitute financial, investment, trading, or other types of advice and is solely the writer’s opinion.
Ethereum Classic [ETC] saw exponential growth after a streak of green candles from its 15-month support near the $13.6-mark. This buying spree positioned the altcoin above the 50% Fibonacci level and exhibited a bullish narrative.
ETC jumped over the EMA ribbons post the near-term buying resurgence above its long-term trendline support (previous resistance). A reversal from the 61.8% Fibonacci resistance could pose some recovery hurdles before a likely bullish comeback. At press time, the alt traded at $33.7, up by 24.98% in the last 24 hours.
ETC Daily Chart

ETC’s dip from its April highs put the alt on a long-term bearish track as it kept finding fresher multi-monthly lows to rest on. The four-month trendline resistance (now support) curtailed the buying pressure until recently.
After the bearish pennant breakdown, ETC witnessed a staggering 151% return on investment (ROI) from its 13 July low until press time. Consequently, the alt inflicted a bullish flip on the north-looking EMA Ribbons.
While the Point of Control (POC, red) provoked a bullish flag-like structure, the recent bullish engulfing candlestick confirmed the bullish breakout. Also, the trading volumes saw an uptick of over 268% in just the last 24 hours. This jump reinforced the bullishness in the current structure.
With the 61.8% Fibonacci resistance standing sturdy, reversals from this level could cause a near-term slowdown. In this case, the buyers could look to re-enter the $26-$28 range to provoke another rally. This revival would aim to retest the $34-zone.
Rationale
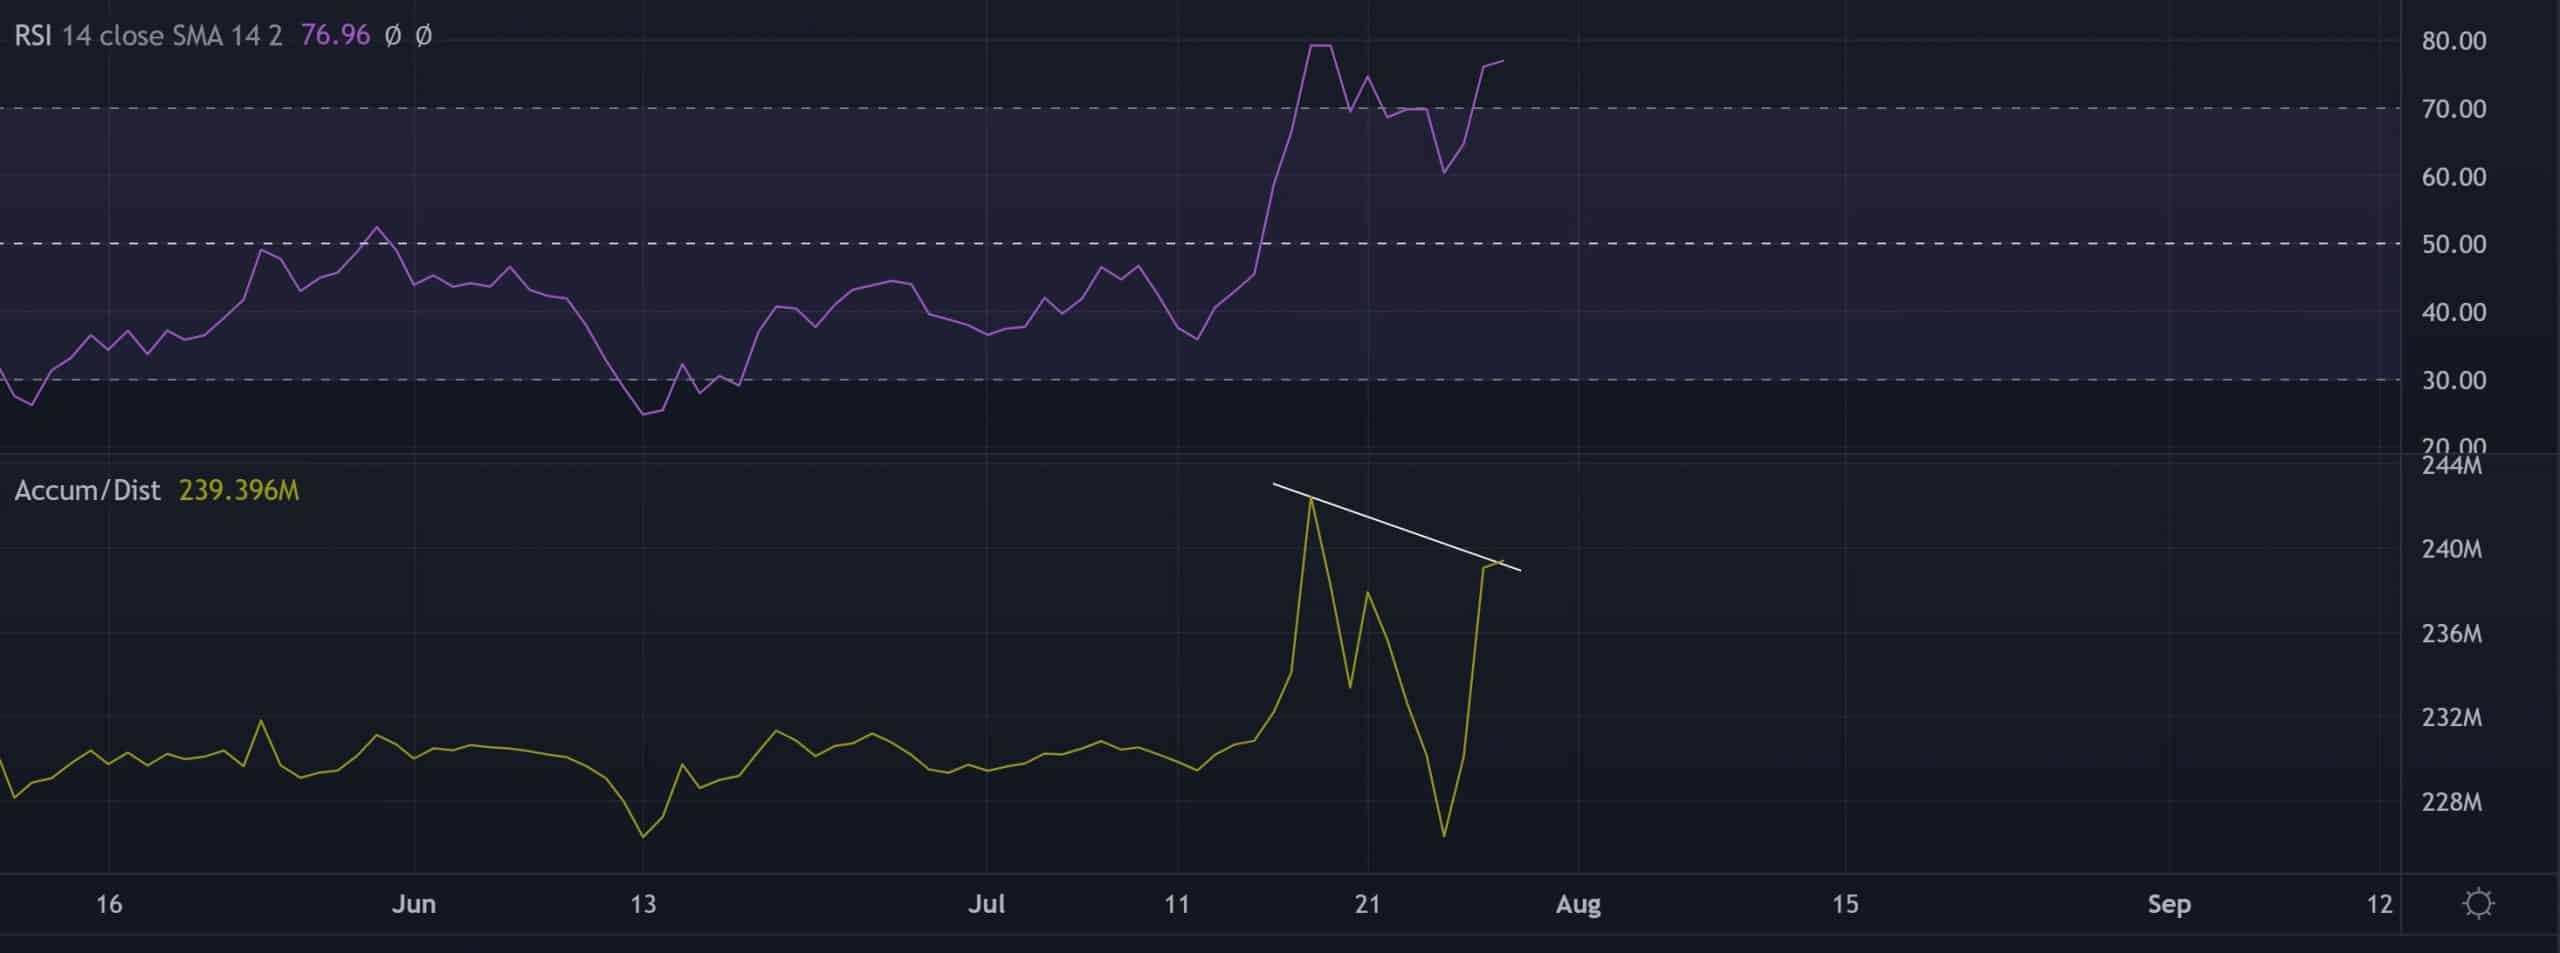
The Relative Strength Index (RSI) hovered in the overbought region to reflect a one-sided buying edge. A potential reversal from this region could ease the heightened buying pressure.
Also, the Accumulation/Distribution saw lower peaks over the last few days and hinted at a bearish divergence with the price.
Conclusion
If ETC finds a reversal at the 61.8% level, it could see a near-term pullback before picking itself up to continue its bullish run. In this case, the take-profit levels would remain the same as above.
Finally, the broader market sentiment and the on-chain developments would play a vital role in influencing future movements. This analysis is critical to identify any bullish invalidations.