Ethereum Classic’s [ETC] breakout chances – The when, how, and why of it all

Disclaimer: The findings of the following analysis are the sole opinions of the writer and should not be considered investment advice
After a significantly steep uptrend for a month, Ethereum Classic [ETC] saw a relatively dull week. The selling re-emergence pulled the altcoin below the four-hour 200 EMA (green) to reveal its bearish edge.
The altcoin’s press time break beyond the trendline support (white, dashed) could prevent the streak of red candles in the coming sessions.
At press time, the altcoin was trading at $33.67, down by nearly 1.7% in the last 24 hours.
ETC 4-hour Chart
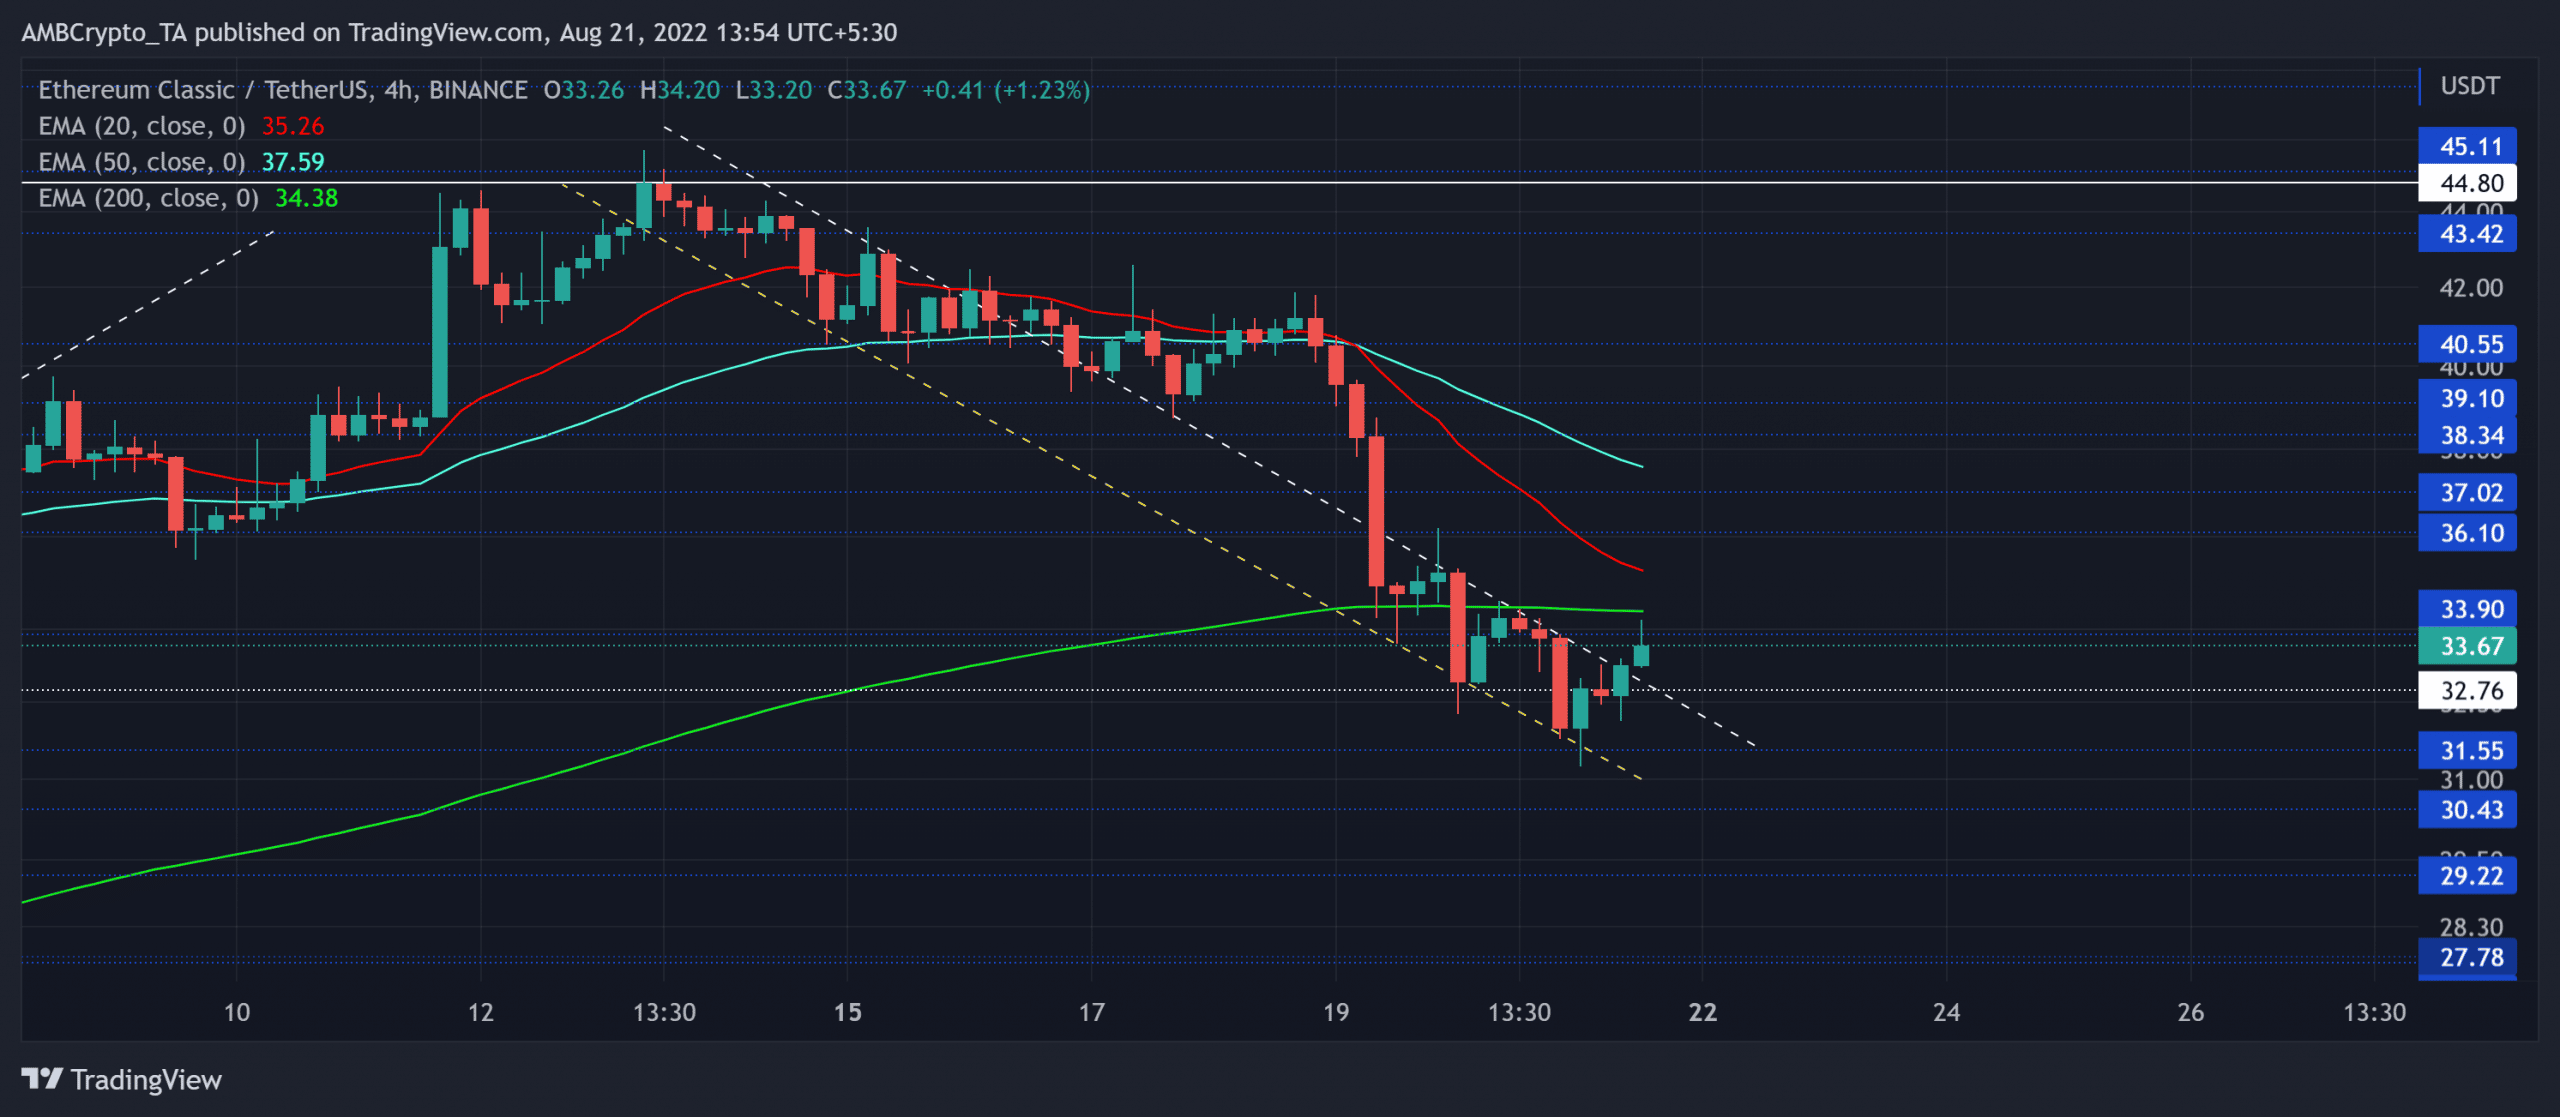
ETC witnessed a staggering ROI of over 200% from its mid-July lows. As a result, it hit its four-month high on 13 August.
Over the last few days, ETC broke into high volatility after reversing from the $44-zone. This selling comeback helped the bears find a close below the 20/50/200 EMA in this timeframe. Meanwhile, the week-long trendline support (yellow, dashed) and the $32 baseline coincided and offered rebounding grounds for ETC.
However, with the bears aiming to inflict a bearish crossover of the 20/200 EMA, the bulls still need to ramp up buying volumes. The close above the 200 EMA can aid buyers in retesting the 20 EMA region in the $35-$36 range.
Should the broader sentiment continue to fuel the bearish vigor, the altcoin would likely see a reversal from the near-term EMAs in its southbound journey. If the buyers remain adamant about defending the $32-level, ETC could mark a compression phase.
Rationale
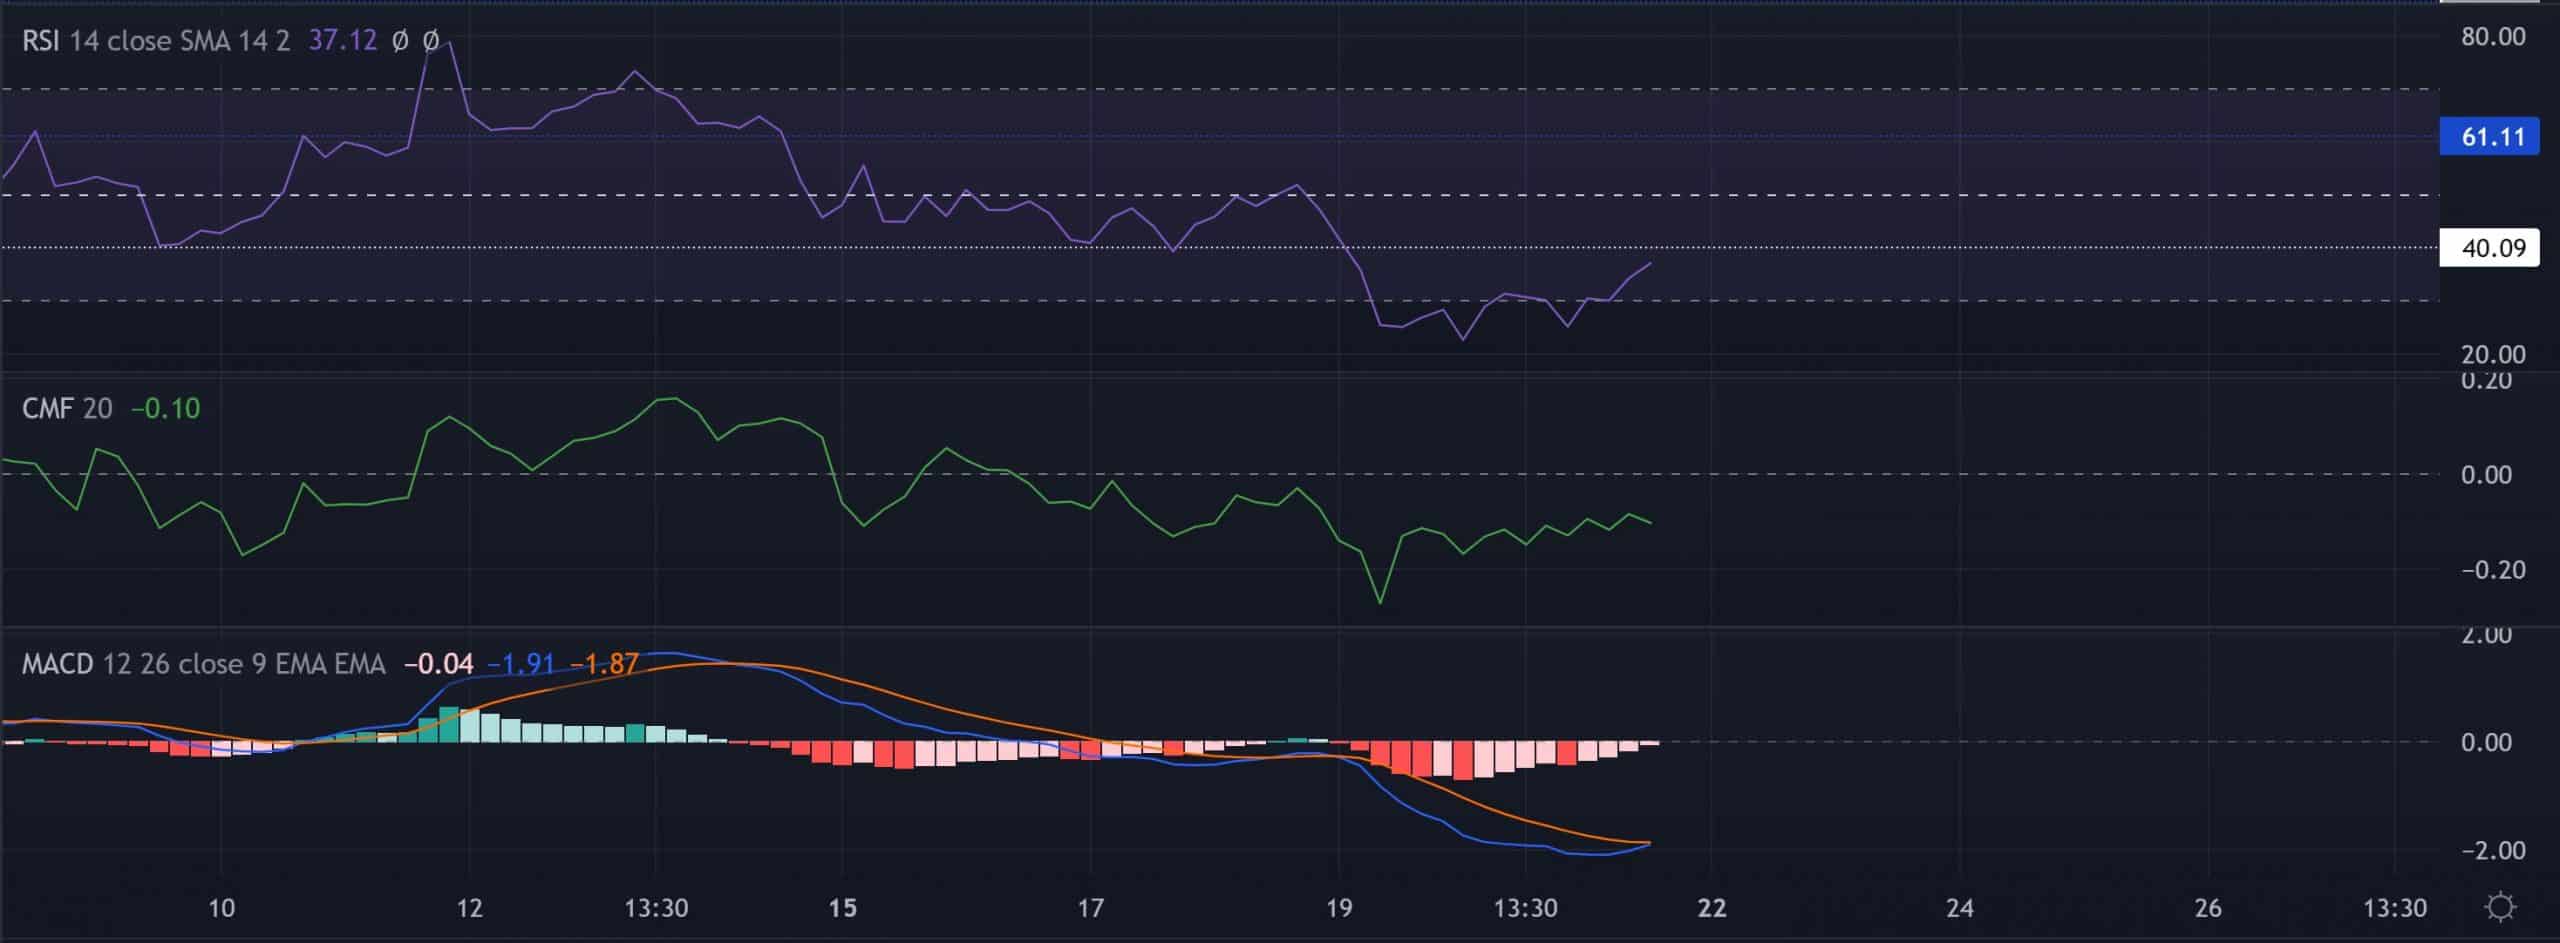
The Relative Strength Index (RSI) saw a solid surge from the ashes of its oversold lows. A sustained growth beyond the 40-mark would further reinforce the near-term revival prospects.
On the other hand, the CMF could not corroborate the price action’s lower troughs. Thus, forming a bullish divergence in this timeframe. Also, the MACD lines were on the verge of a bullish crossover. The continued northward movement of these lines could propel a low volatility phase before a breakout.
Conclusion
Given the receding selling volumes alongside the potential of the indicators, ETC could see a near-term revival before falling back into its bearish track. The death cross on the EMAs could confirm the bearish bias. The targets would remain the same as discussed.
Finally, broader market sentiment and on-chain developments would play a vital role in influencing future movements.