Ethereum, Dogecoin, Polkadot Price Analysis: 22 December

As the crypto fear and greed index is just five points below the ‘Neutral’ sentiment, the crypto market sees a decent recovery.
Consequently, Ethereum saw a much-awaited jump above the $4,000 mark but displayed a weak directional trend. On the other hand, Dogecoin consolidated and DOT crossed the 50-SMA while flashing bullish technicals.
Ethereum (ETH)

As mentioned in the previous article, ETH saw an expected trend reversal after forming a month-long falling wedge. It saw a 10.41% incline in just six days. As a result, ETH crossed the $4000-level after retesting that mark four times. Over the past few days, It formed a symmetrical triangle on its 4-hour chart. Now, to confirm the bullish strength, the alt will need to cross the $4,100-mark on increased volumes.
Even though the bulls reclaimed the $4000-mark, ETH witnessed a bearish divergence between the price action and the RSI (blue trendline).
Any further breakdown would find a testing point around the 20-50 SMA in the demand zone. At press time, ETH traded at $4,039.01. The RSI breached the 59-mark for the first time since 1 December, indicating an increased bullish influence.
Although OBV was in an uptrend for the past week, it did not match the previous levels at the $4000-mark. Further, the decreasing volumes on the volume oscillator affirm that ETH bulls could not gather enough buying pressure.
Dogecoin (DOGE)
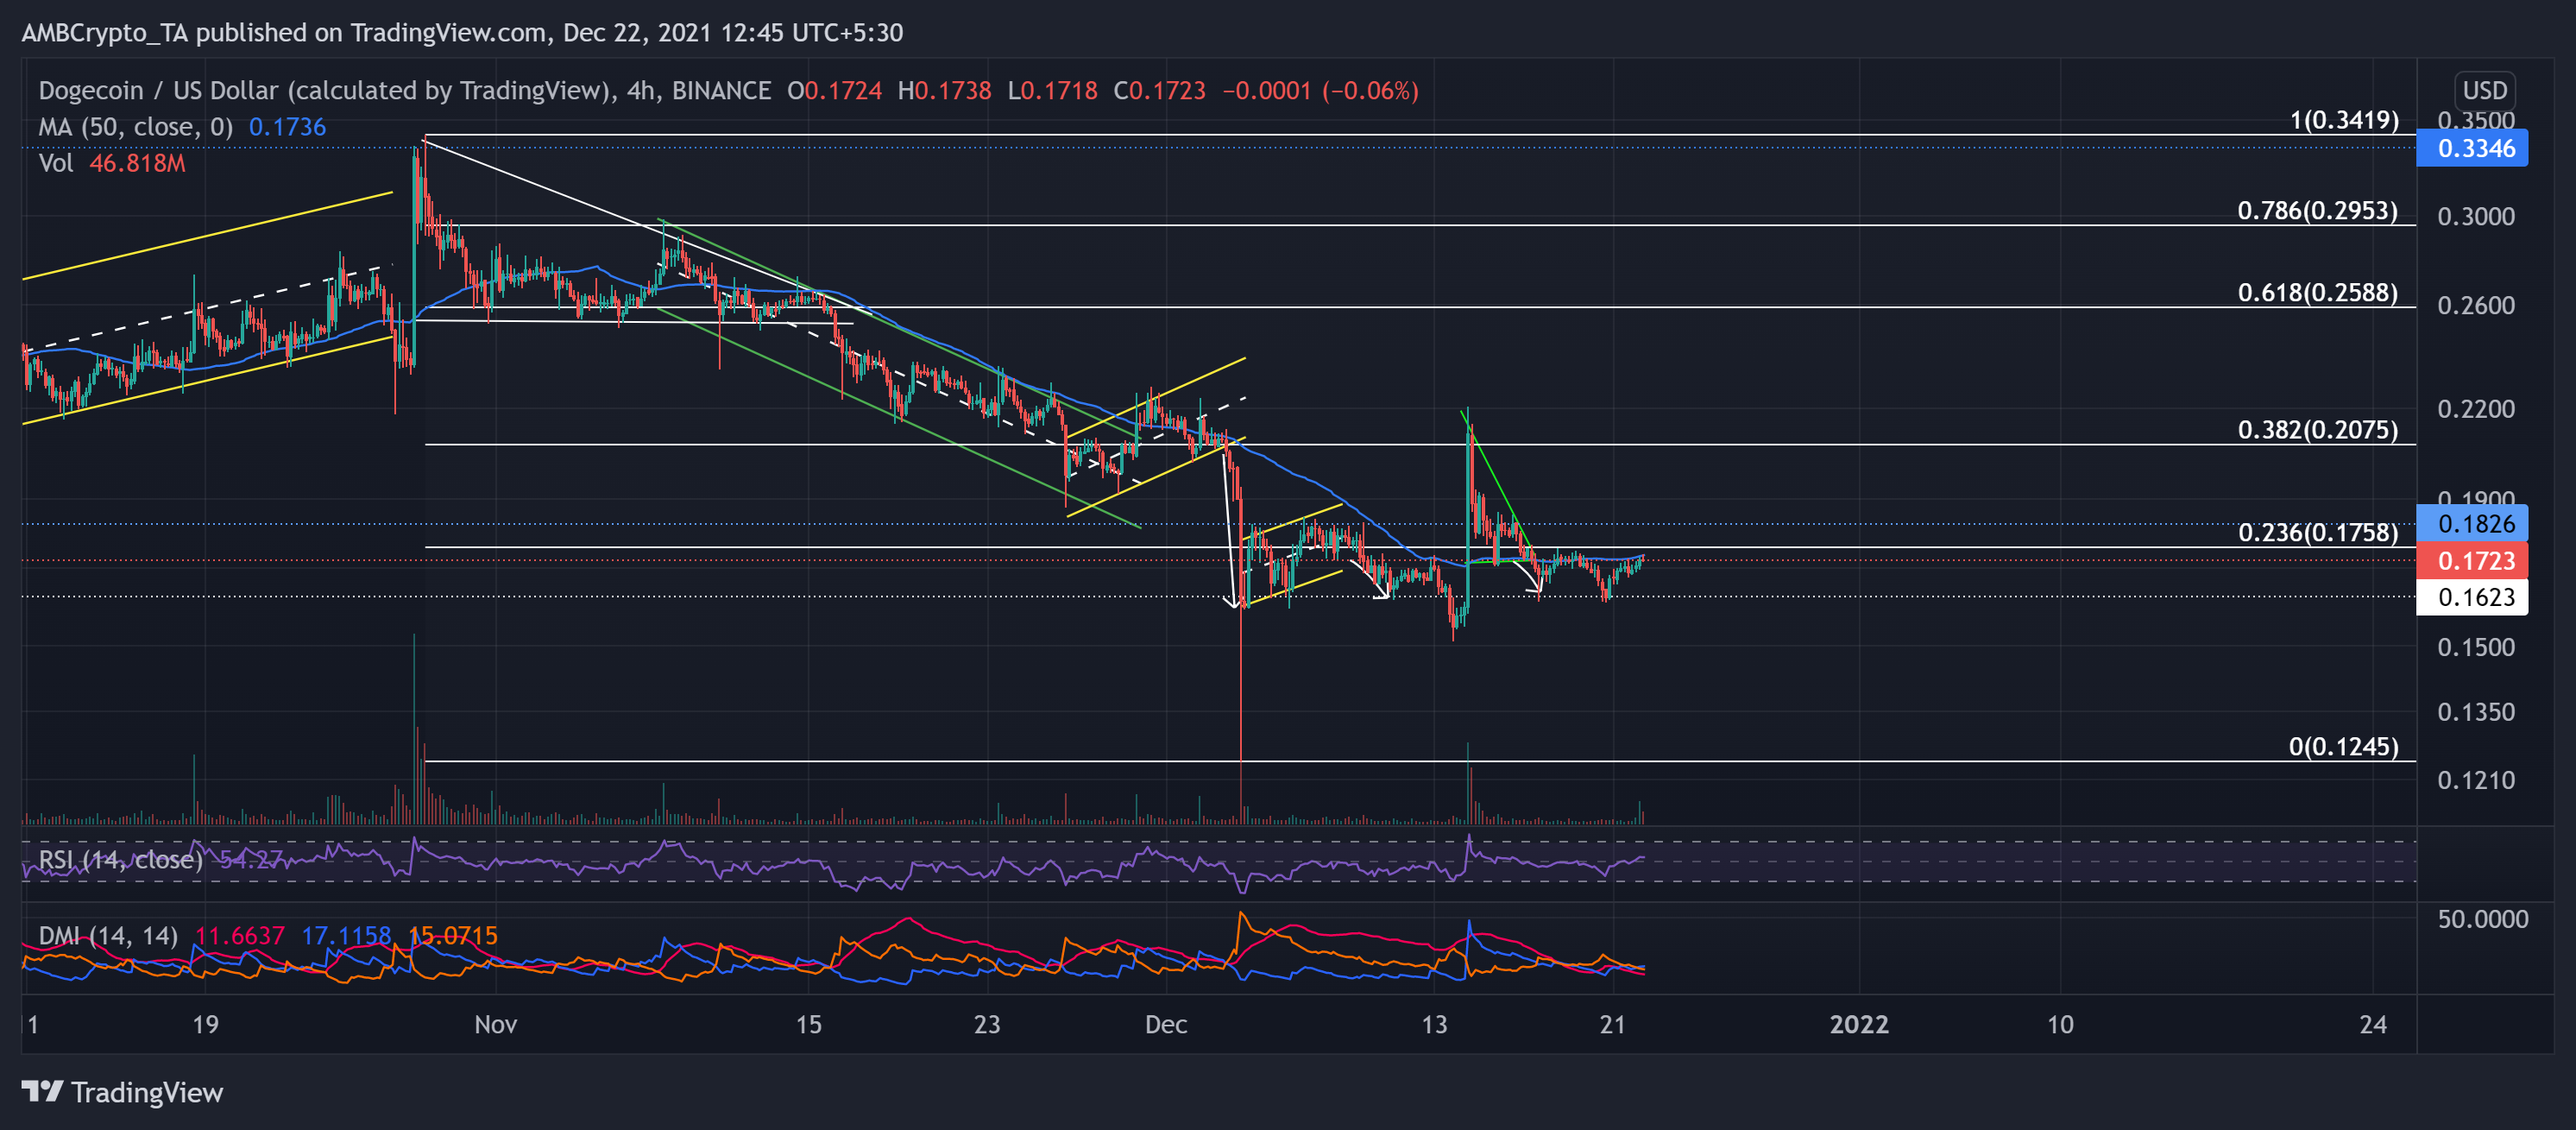
DOGE retraced more than its previous bull run as it lost half of its value over the last 54 days.
This pullout ensured the 23.6% Fibonacci resistance as the price struggled to leap the $0.175-level. Moreover, the 50-SMA (blue) stood just below the above mark and ensured an immediate testing point for bulls.
After a descending triangle (green) breakout, DOGE found an oscillating range between the $0.162 and $0.182-mark. At press time, DOGE traded at $0.1723. The RSI saw a 20 point surge in two days and jumped above the equilibrium, depicting a bullish bias. Although the DMI displayed a marginal bullish bias, the ADX was substantially weak.
Polkadot (DOT)
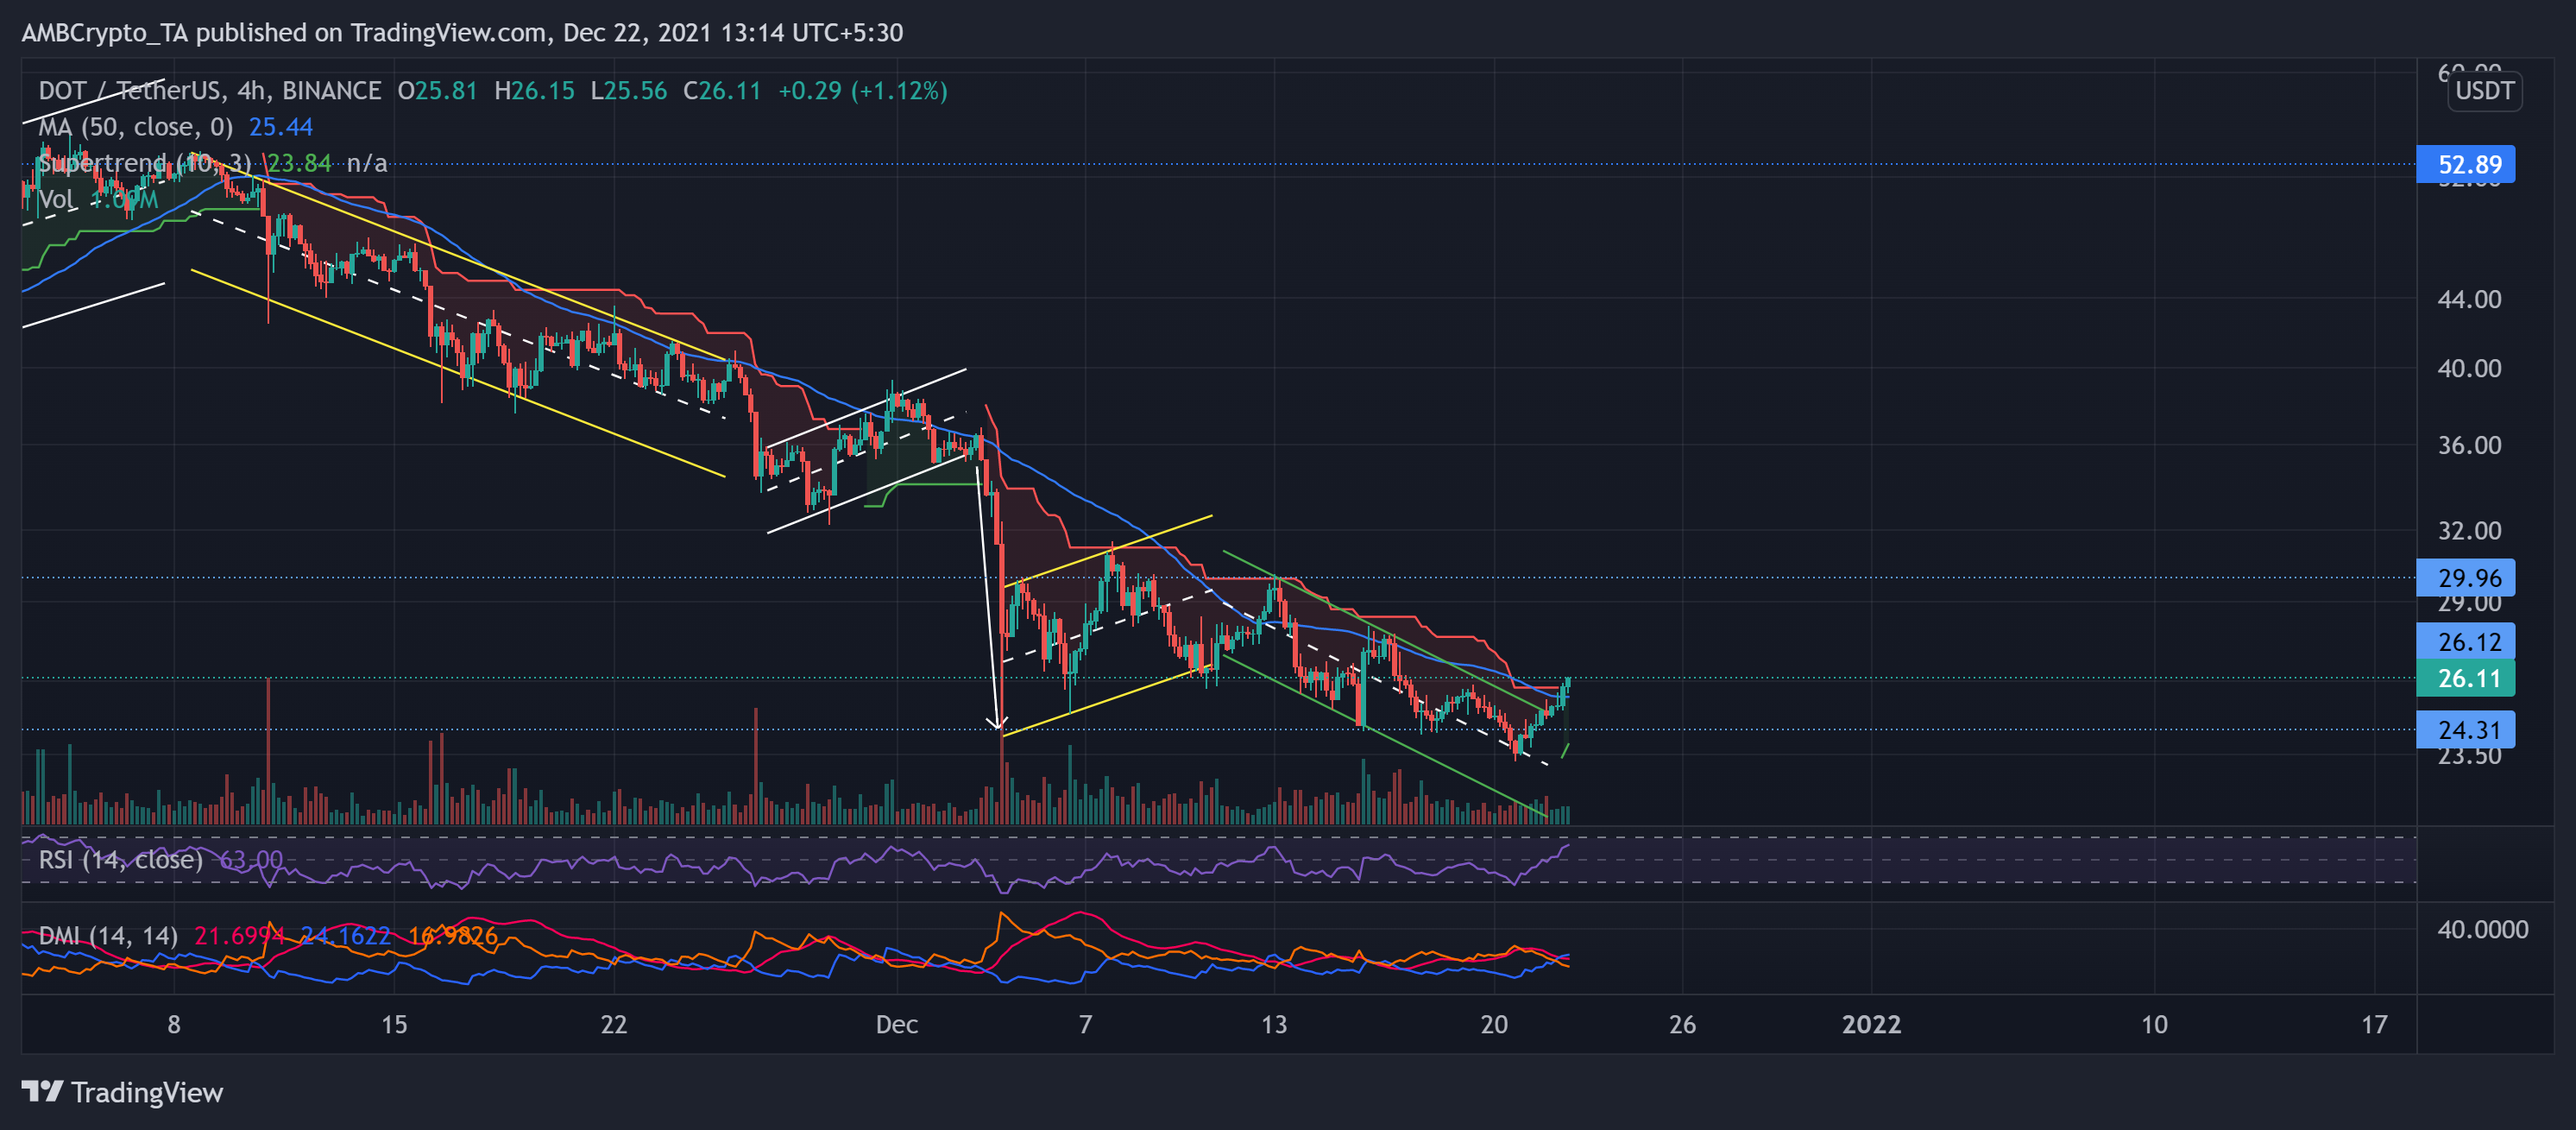
Like DOGE, DOT bears over-retraced its previous bull run in an up-channel (white) as the token lost its 16-week previous support at the $26-mark. In the past few days, bulls retested the above channel (green) multiple times until DOT witnessed a down-channel breakout on 21 December.
Thus, the Supertrend finally flashed a green sign after mostly wavering in the red zone. Now, as the bulls crossed the 50-SMA (blue) hurdle, the immediate resistance stood at the $26-level. DOT bulls will need to gather increased volumes to initiate a trend-altering rally.
At press time, the alt traded at $26.11 after noting a 5.97% 24-hour gain. The RSI was northbound after a staggering 34 point surge over two days. Further, the DMI reaffirmed the bullish vigor, but the ADX displayed a slightly weak directional trend for the token.


