Ethereum ETF records $84.6M weekly inflow, but trails Bitcoin
Ethereum ETFs recorded their largest inflow in over a month, bringing in $84.6 million last week.

- Ethereum ETFs saw $84.6 million in inflows, but still lag far behind Bitcoin ETF inflows.
- Despite price dips, Ethereum remained above its 50-day moving average, indicating short-term bullish momentum.
The Ethereum [ETH] ETFs have experienced their largest inflow in over a month, according to recent data.
Despite this, ETH ETF inflows still significantly lag behind those of Bitcoin[BTC], reflecting a stronger preference for Bitcoin ETFs.
First weekly inflow since August
Data from SosoValue shows that the Ethereum ETFs saw over $84.6 million in inflows last week, with positive inflows recorded on three out of five trading days.
This marks the highest weekly inflow since the 9th of August. However, despite this growth, Ethereum ETF volumes remain far below Bitcoin’s ETF performance.
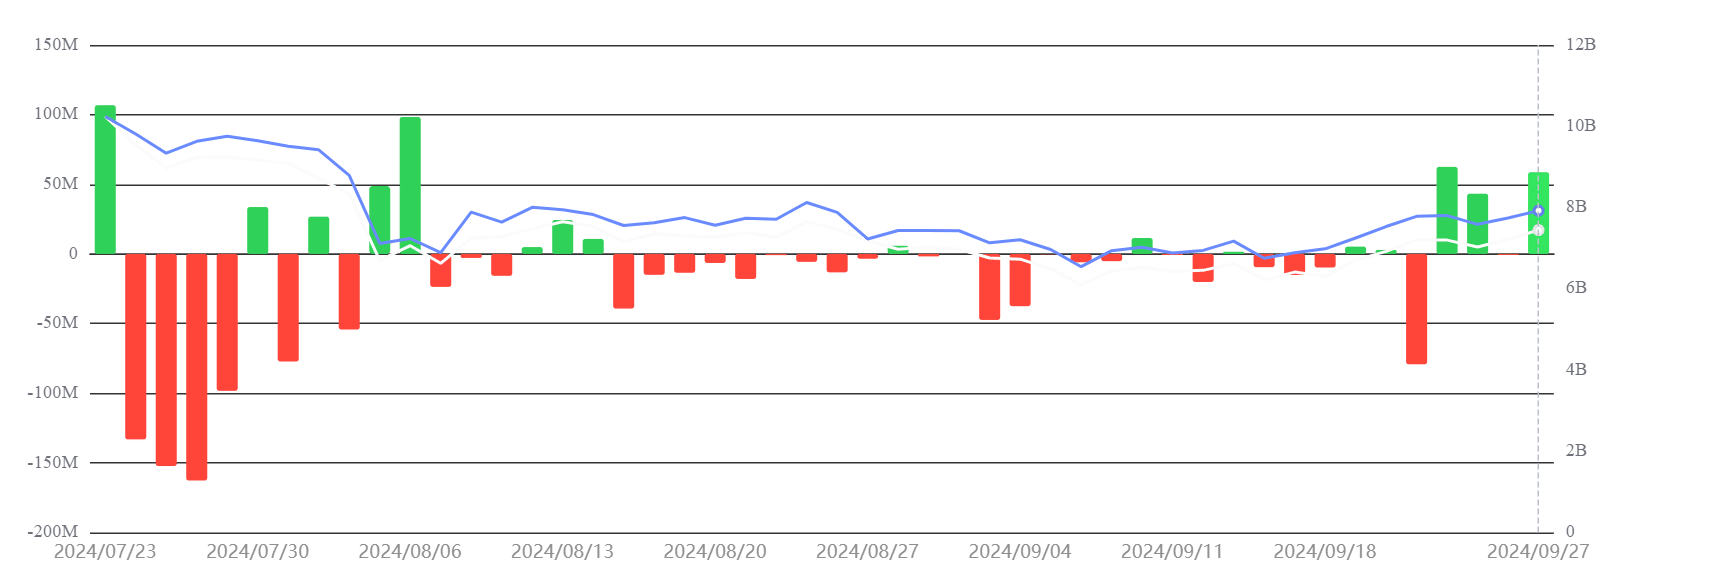
In comparison, Bitcoin ETFs recorded a whopping $1.11 billion in inflows during the same week, with inflows occurring every day.
This was Bitcoin’s largest weekly inflow since the 19th of July.
Ethereum ETF still lagging behind Bitcoin
The Ethereum ETFs began trading in the U.S. on the 23rd of July, roughly six months after Bitcoin ETFs.
In the five weeks following the launch of Ethereum ETFs, the funds saw net outflows of around $500 million, while Bitcoin ETFs recorded net inflows of over $5 billion.
Bitcoin’s first-mover advantage is one of the reasons for this disparity.
The excitement surrounding Bitcoin’s ETF launch has driven significant inflows, while ETH’s ETF launch, though promising, has generated less buzz over time.
Additionally, the value difference between the two assets plays a role—Bitcoin holds over 50% of the crypto market cap, while Ethereum holds about 14%.
ETH price declines as September ends
In the past few days, Ethereum’s price has dipped, falling below the $2,600 level.
At the time of writing, Ethereum was trading at around $2,597, down over 2%. Despite the decline, ETH remains above its 50-day moving average, indicating a short-term bullish trend.
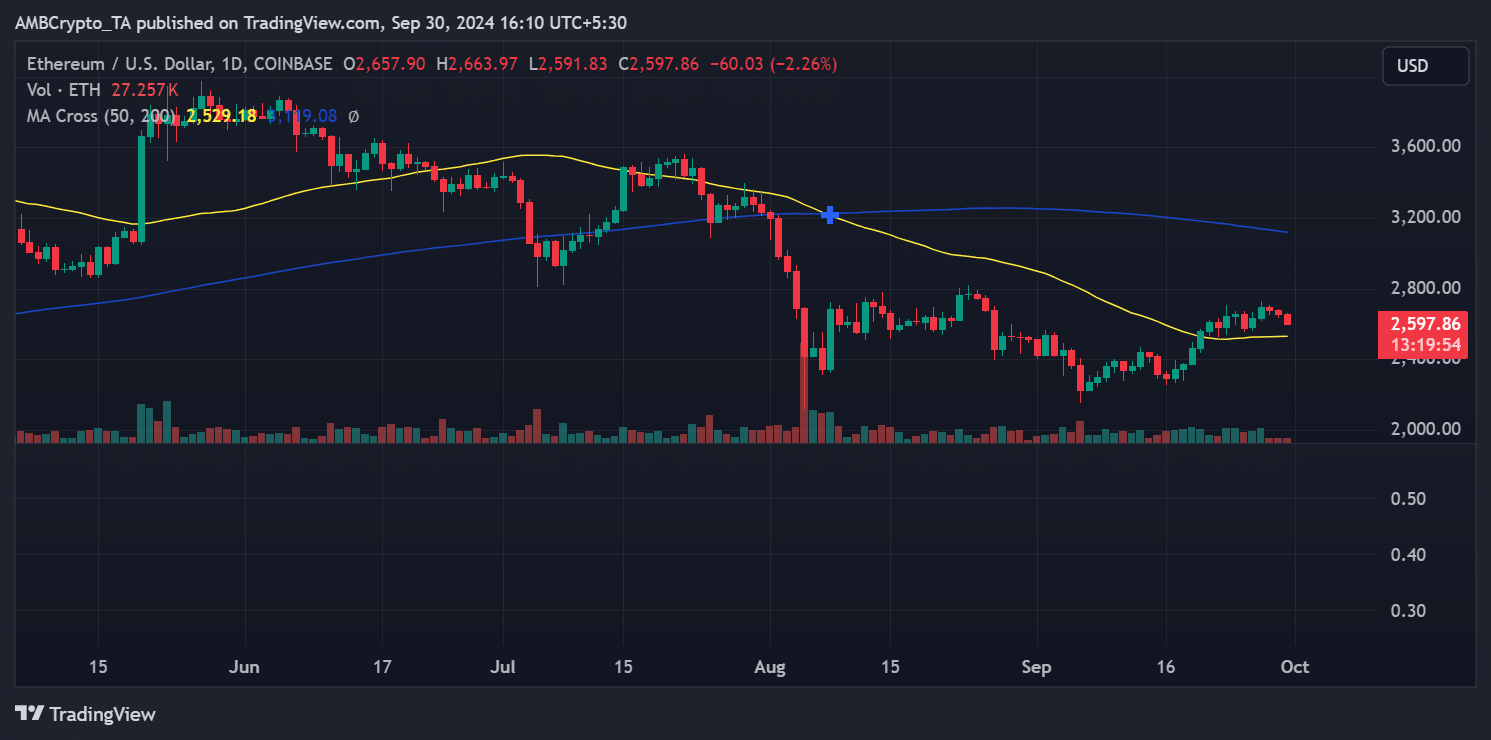
The Relative Strength Index (RSI) was around 53, reinforcing the bullish outlook suggested by the moving average.
Realistic or not, here’s ETH market cap in BTC’s terms
While The Ethereum ETF has seen a notable inflow after a slow period, it remains far behind Bitcoin ETFs in terms of volume and investor interest.
Factors such as Bitcoin’s first-mover advantage and market dominance play key roles in this trend. Despite recent price declines, Ethereum remains in a bullish position, holding above key technical indicators.


