Ethereum [ETH]: $950-$1050 could offer opportunities for…

Disclaimer: The findings of the following analysis are the sole opinions of the writer and should not be considered investment advice.
Ethereum dumped below the $1700 demand zone in early June, and recovery was not yet in sight for the king of altcoins. The $1300 resistance was not yet breached, and the $1000 band of support has been defended over the past month.
Ethereum appeared to form a range, but it was likely following in the footsteps of Bitcoin. The king coin also developed a range, and patience would be needed to navigate the markets without taking many losses.
ETH- 12-Hour Chart
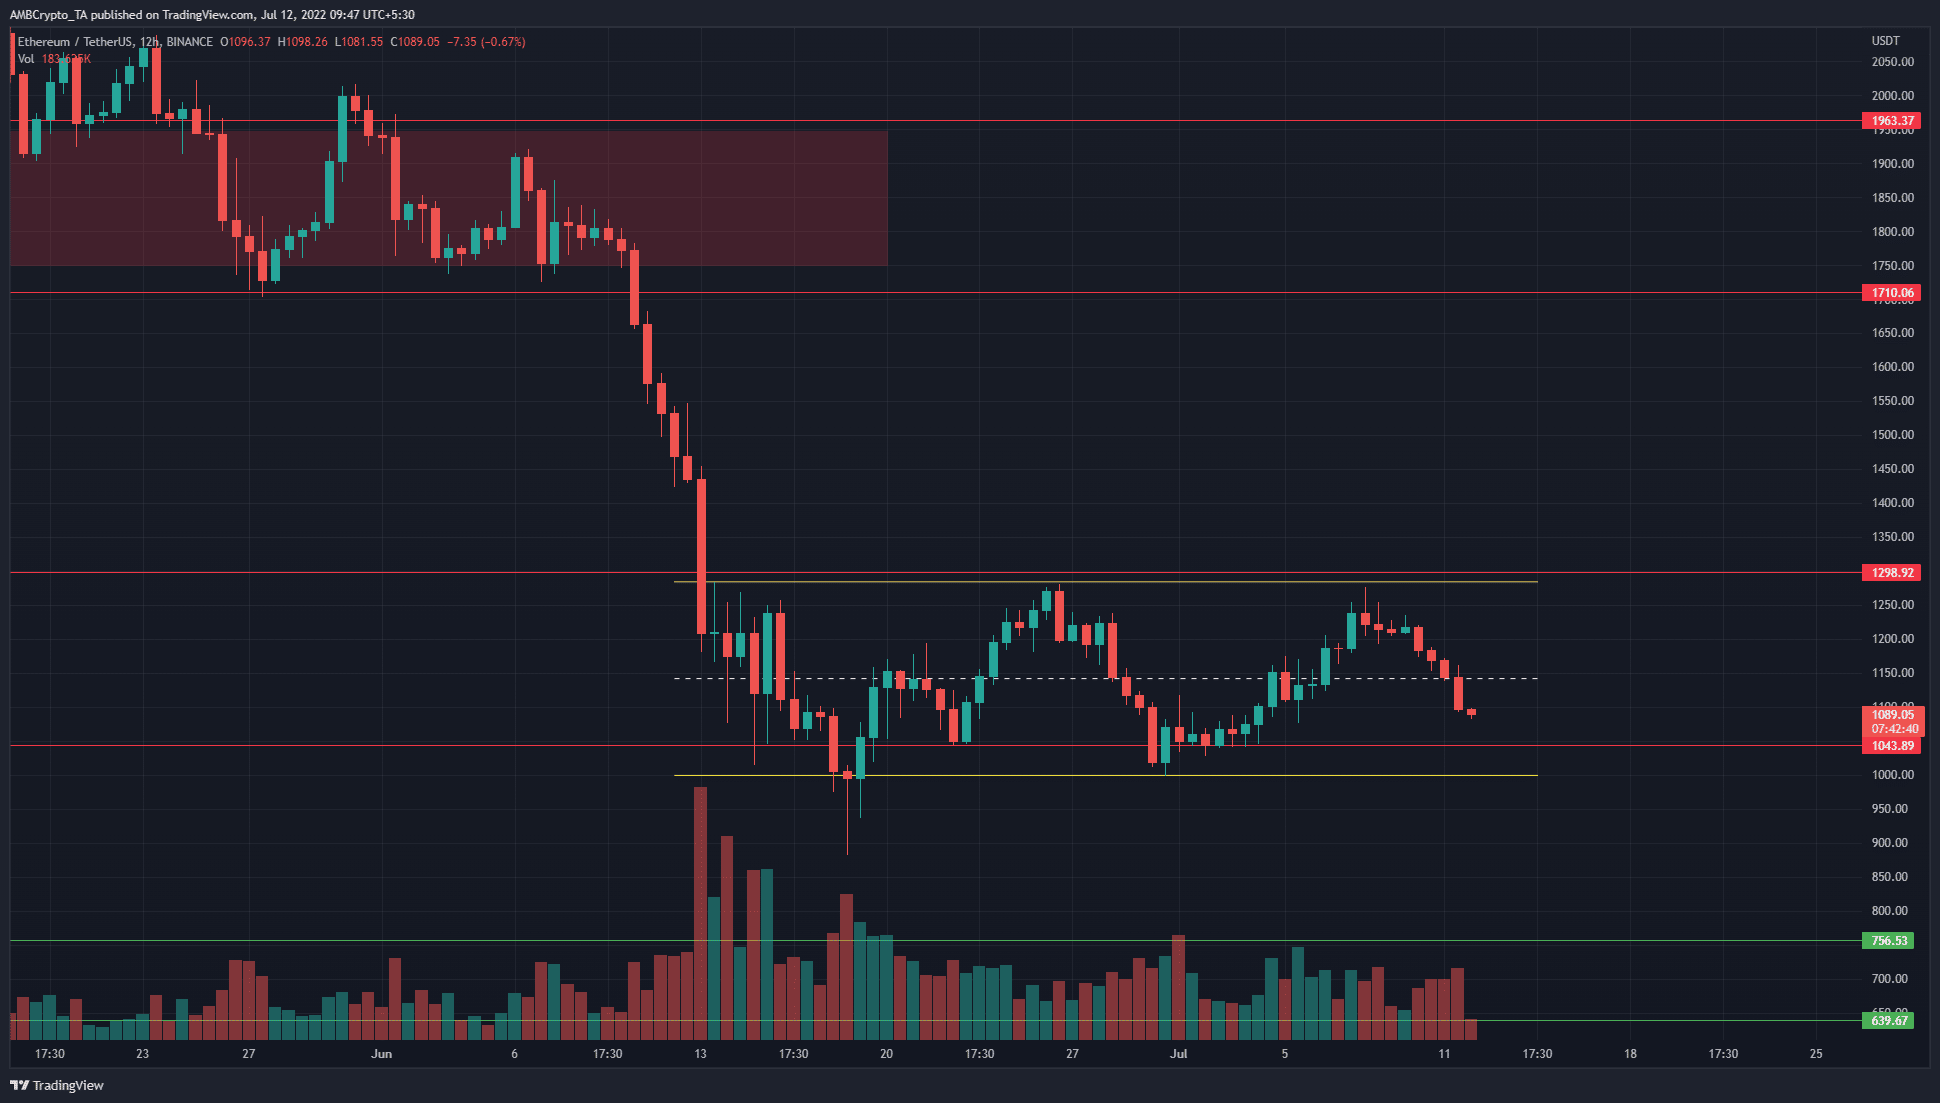
The range (yellow) ETH formed was between the $1285 and $1000 levels. The mid-point of the range lay at $1143, and it has been respected as both support and resistance in recent weeks. Therefore, the range pattern has added credibility.
Trading volume for the past month has been greater than April or May individually, and the trade volume has been somewhat steady in recent weeks. This indicated that ETH was trading at a place where long-term bulls and bears are interested. Being a psychological level of importance as well, $1000 would be a critical region for Ethereum buyers to defend.
In the past few days, an advance to $1300 was rebuffed at $1280. Moreover, the price dipped below the mid-point of the range as well. This firmly hinted at a move toward the range lows.
Rationale
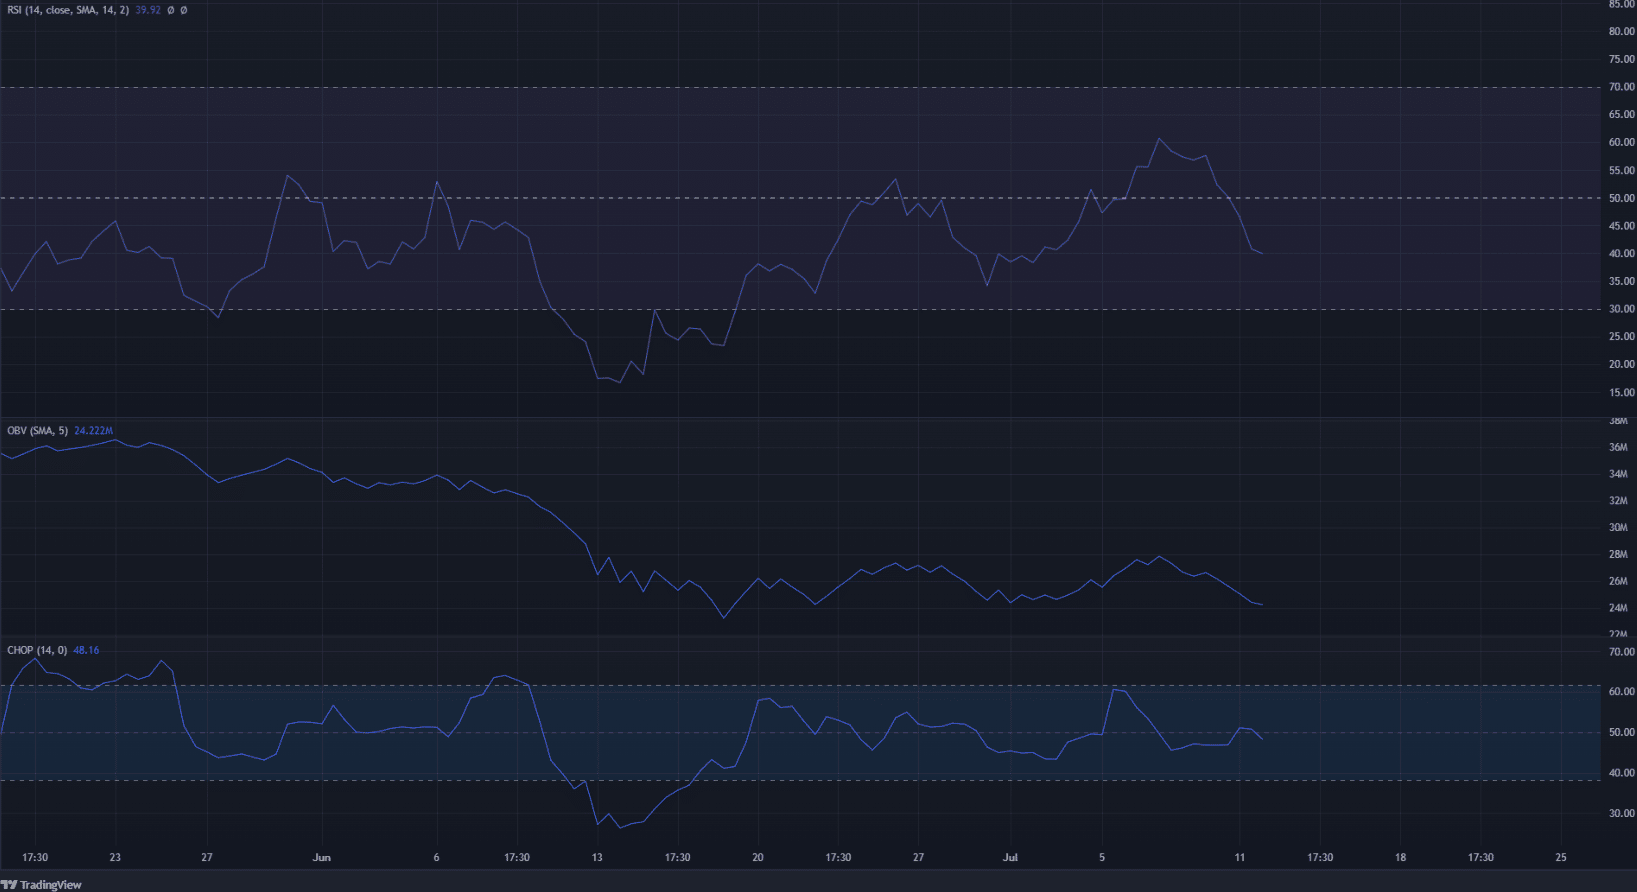
The RSI attempted to climb past 60 in the past few days but was unable to. The 12-hour RSI has consistently been below neutral 50 since early April, which indicated that the downtrend behind Ethereum remained strong. The brief foray to 60 does not imply a trend reversal.
The OBV was also in a downtrend since April but has been quite flat over the past month. Once again, neither buyers nor sellers have had the upper hand in the past four weeks, further strengthening the idea of a range. The Choppiness Index stood at 48 to signal the lack of a strong trend.
Conclusion
The market structure remained for Ethereum bearish and would flip bullish only if the $1300 mark was breached. In the meantime, the $1000 demand zone was a must-defend area for bulls. The $950-$1050 area could offer buying opportunities.