Ethereum [ETH] bounces from $1600 but bearish bias remains: Here’s why

Disclaimer: The information presented does not constitute financial, investment, trading, or other types of advice and is solely the writer’s opinion.
- The bearish structure break two weeks ago meant sellers had an edge at press time.
- An imbalance on ETH charts could offer an ideal selling opportunity.
A recent report highlighted that Ethereum [ETH] validators were doing well in terms of generating revenue from staking, despite the volatility in the price. Moreover, on 1 March, Messari revealed that real staking returns improved to 6% in Q4 of 2022.
The Merge vastly improved the economics for stakers.
Real staking returns improved from 1% in Q3 to 6% in Q4 of last year.
The majority of the increase came from a fall in net inflation from 4% to 0%.
FREE @Ethereum Quarterly Report Below 👇 pic.twitter.com/KNBIlIGHDn
— Messari (@MessariCrypto) March 1, 2023
Is your portfolio green? Check the Ethereum Profit Calculator
This was good for long-term holders. Indeed, the price has performed well, considering its rally from early January. Although the market structure was bullish on the higher timeframes, a revisit to $1685 could initiate strong bearish pressure.
The bearish order block around $1700 could pose stern resistance to the price
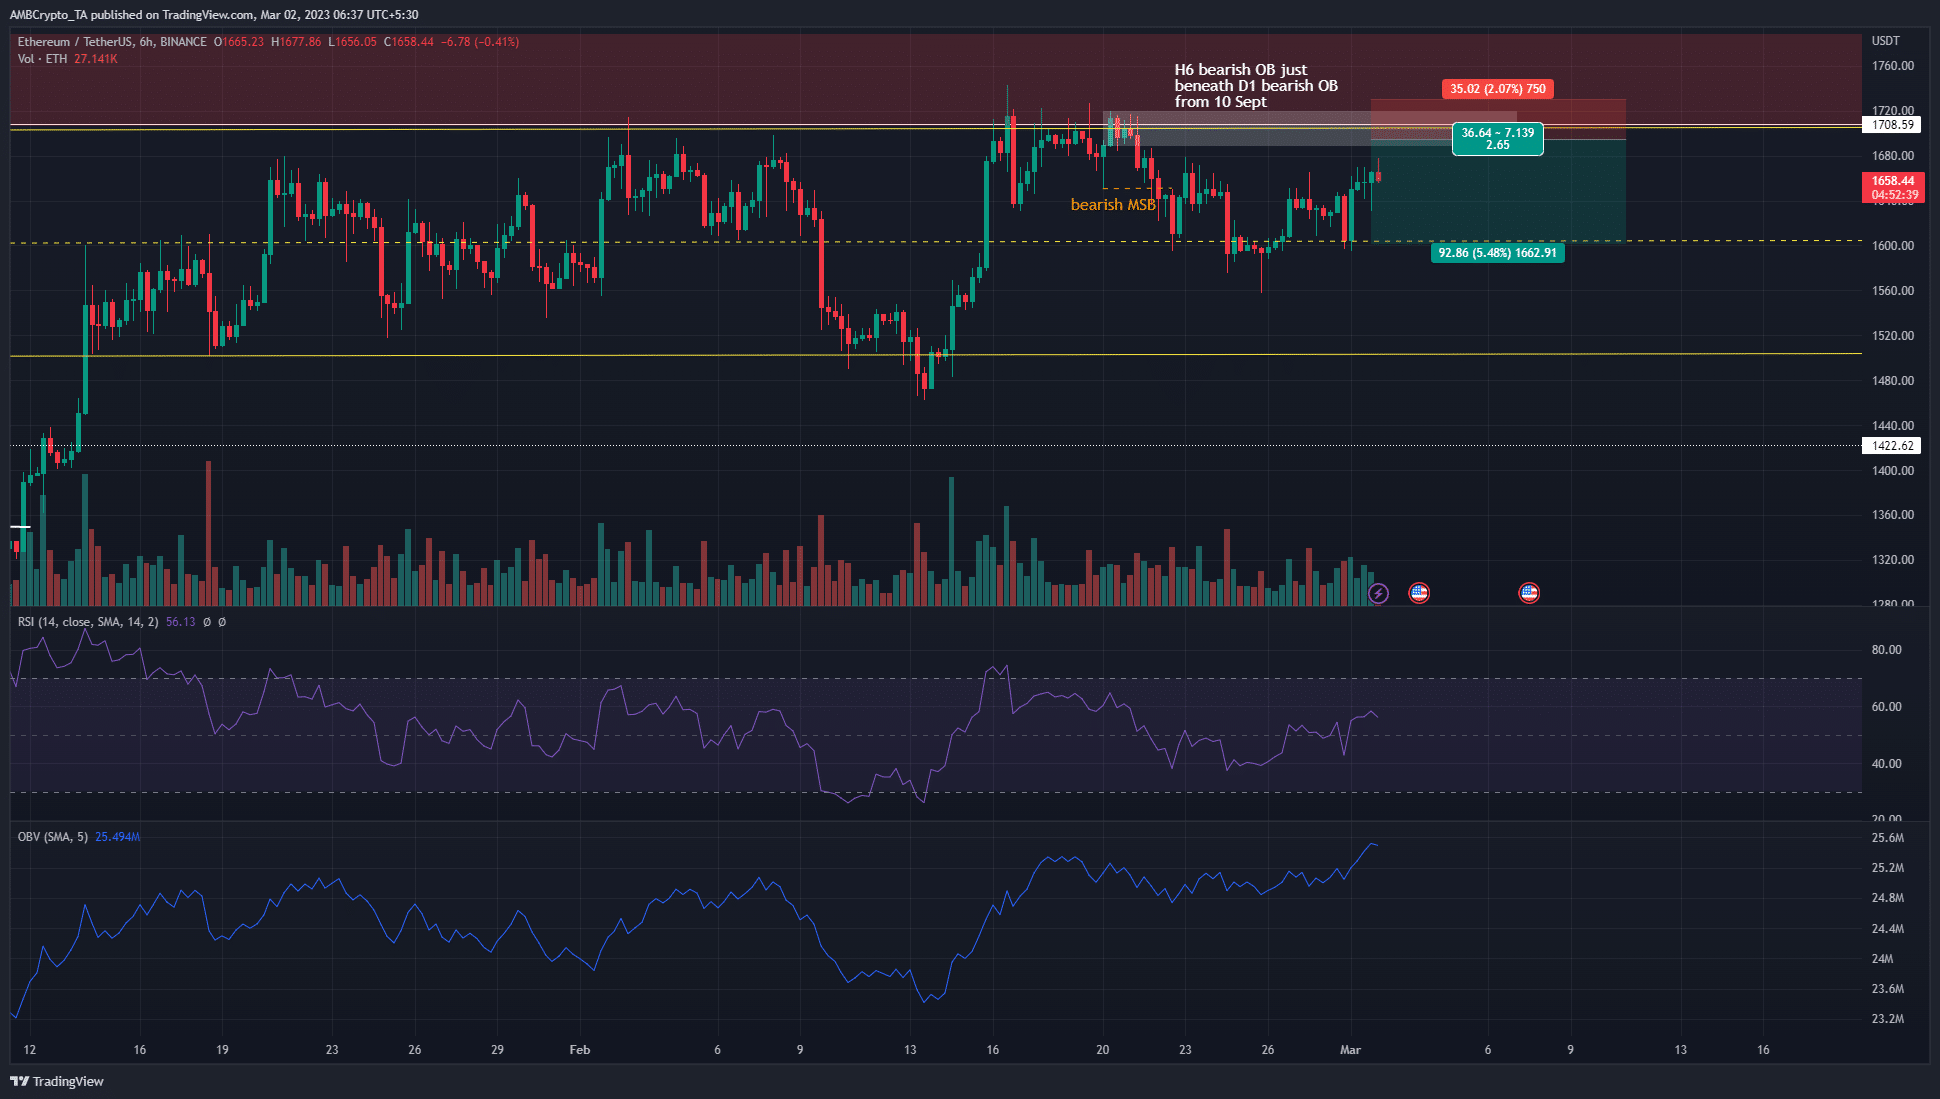
The six-hour price chart showed that ETH broke its bullish structure on 22 February, highlighted in orange. It fell to the $1590-$1605 area on 24 February, an area that continued to serve as a significant area of demand.
At the time of writing, Ethereum appeared to be headed upward after bouncing from $1600 within the past 36 hours. The RSI climbed above neutral 50 to highlight some bullish momentum that had taken hold. The OBV was in an uptrend as well, showing steady buying pressure.
Over the past six weeks, the price has oscillated between $1504 and $1707 as support and resistance, respectively. Highlighted in red was a bearish order block on the daily timeframe from 10 September. The recent break in structure meant short positions were favored.
The shift in structure also showed another bearish order block, this time on the H6 timeframe. Highlighted in white, a retest of this region could offer a shorting opportunity for Ethereum traders. Moreover, there was a fair value gap that extended from $1687-$1695.
A session close above the order block at $1720 would invalidate this bearish idea. Take-profit targets include the mid-range mark at $1600 and range lows at $1504, but this could be very ambitious.
How much are 1,10,100 ETH worth today?
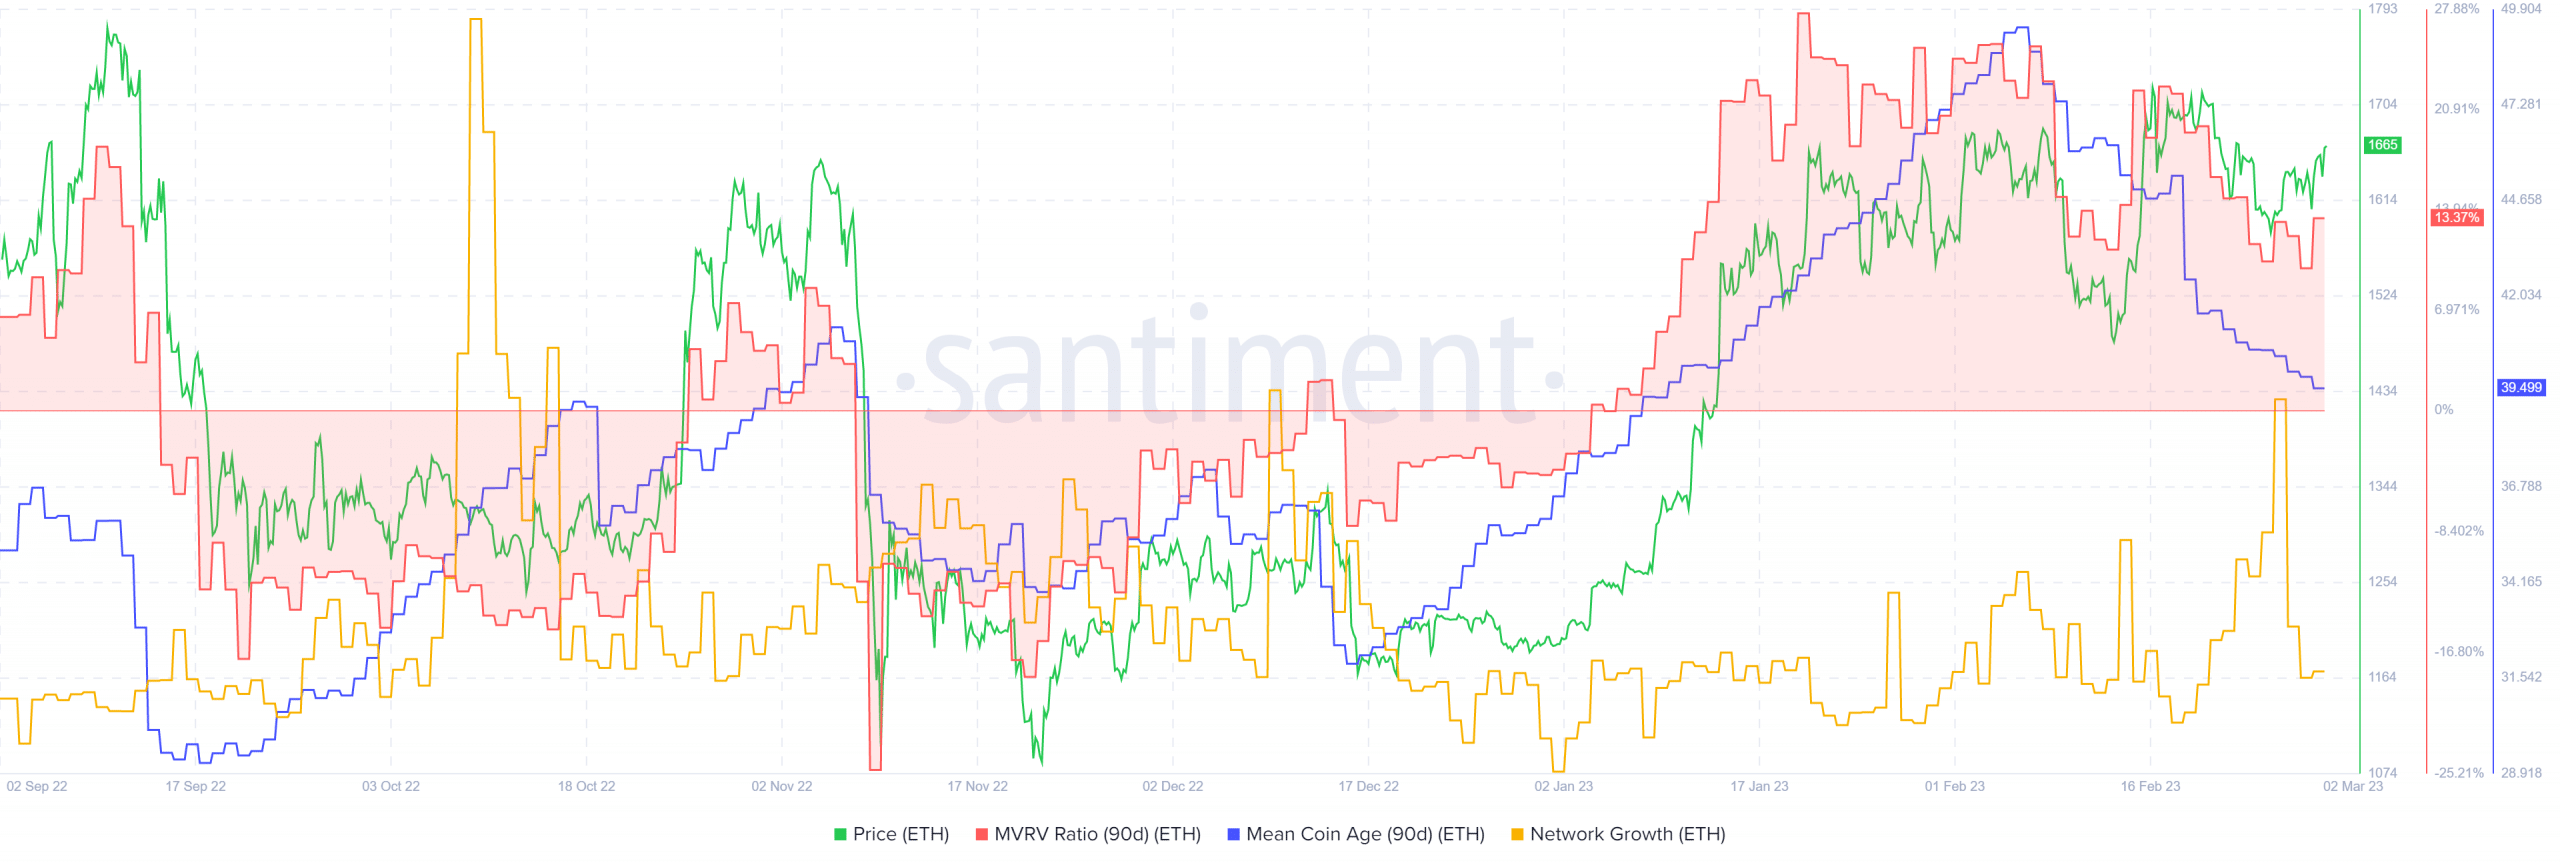
Santiment’s data showed that the 90-day mean coin average was in decline. This underlined the increased movement of ETH between addresses and could result from rising sell pressure. The 90-day MVRV ratio has also declined since mid-February.
On the other hand, the network growth metric saw a sharp spike on 26 February and steadily trended upward throughout February.


