Ethereum [ETH] investors, watch out for this level to look for recovery

Disclaimer: The findings of the following analysis are the sole opinions of the writer and should not be considered investment advice
As macro-economic uncertainties fueled market-wide corrections, the crypto-market’s capitalization plunged below $900 billion.
Over the week, Ethereum [ETH] broke down into high volatility after losing its $1,700-support. The recent bearish engulfing has significantly tarnished buying ability under the current market dynamics.
The fall below the $ 1,000-support level pulled ETH to its January 2021 lows. Any near-term bullish comebacks after the recent rejection of lower prices can help ETH test its immediate supply zone.
At press time, ETH was trading at $1,035.8, up by 4.11% in the last 24 hours.
ETH 12-hour Chart
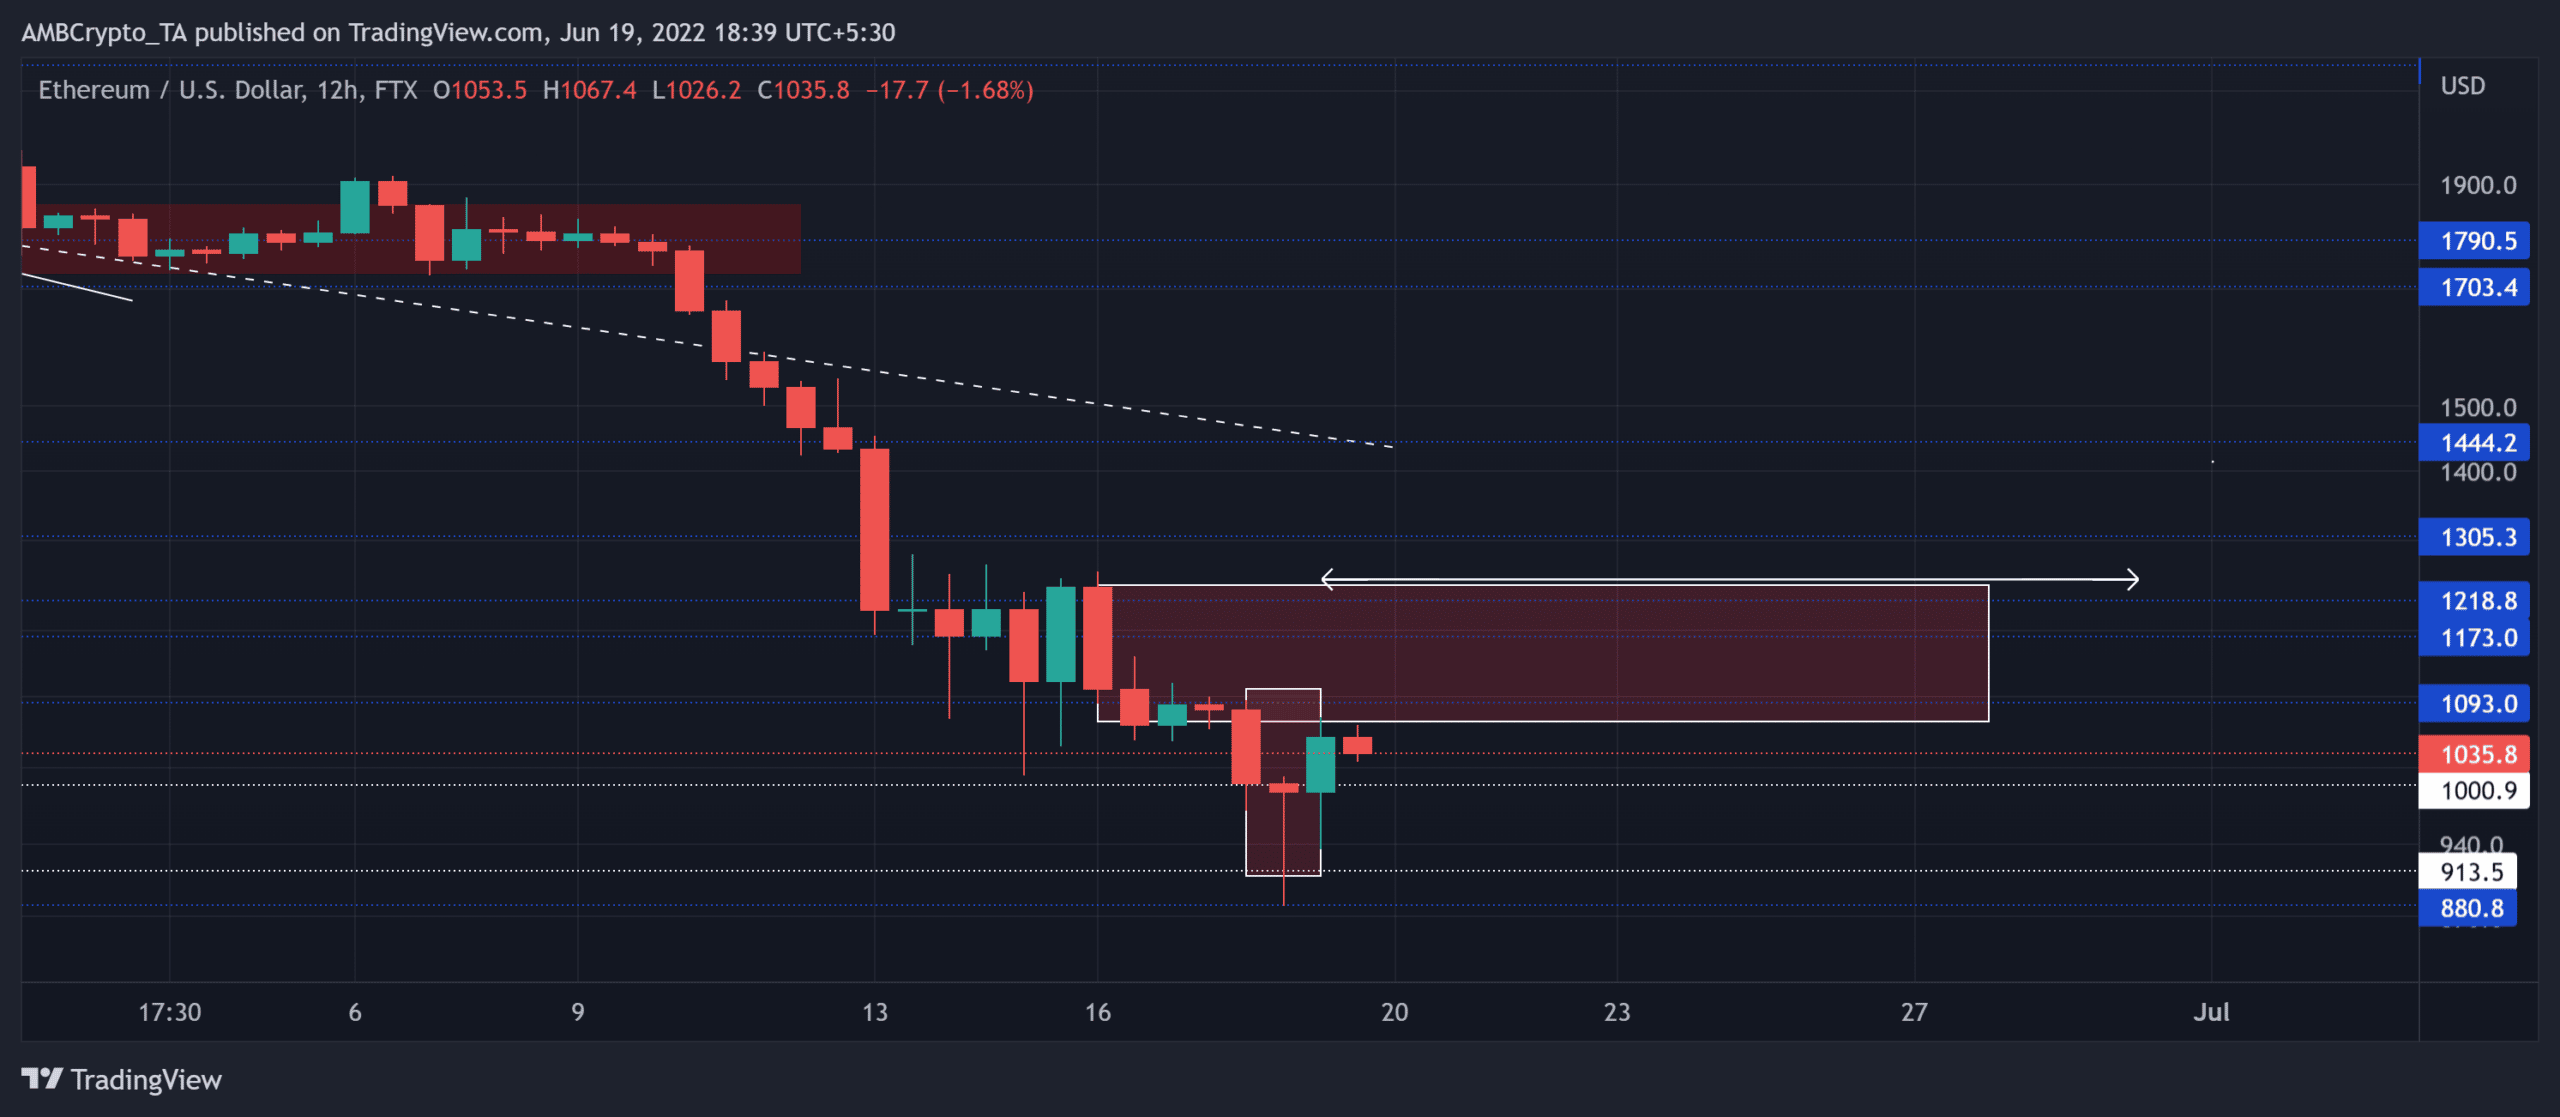
Over this timeframe, ETH saw an evening star setup from the recent rejection of lower prices from the $1,000-support. A sustained close beyond the $$1,093-level could aid near-term buying efforts to test the bounds of its immediate supply zone.
In this case, the targets would lie in the $1,173-$1,129 range. However, the current candlestick would need to close as green to reaffirm the strength of the morning star candlesticks. Any close below the $1,000 support would invalidate the buying tendencies while the sellers could aim to retest the $930-zone.
ETH Daily Chart
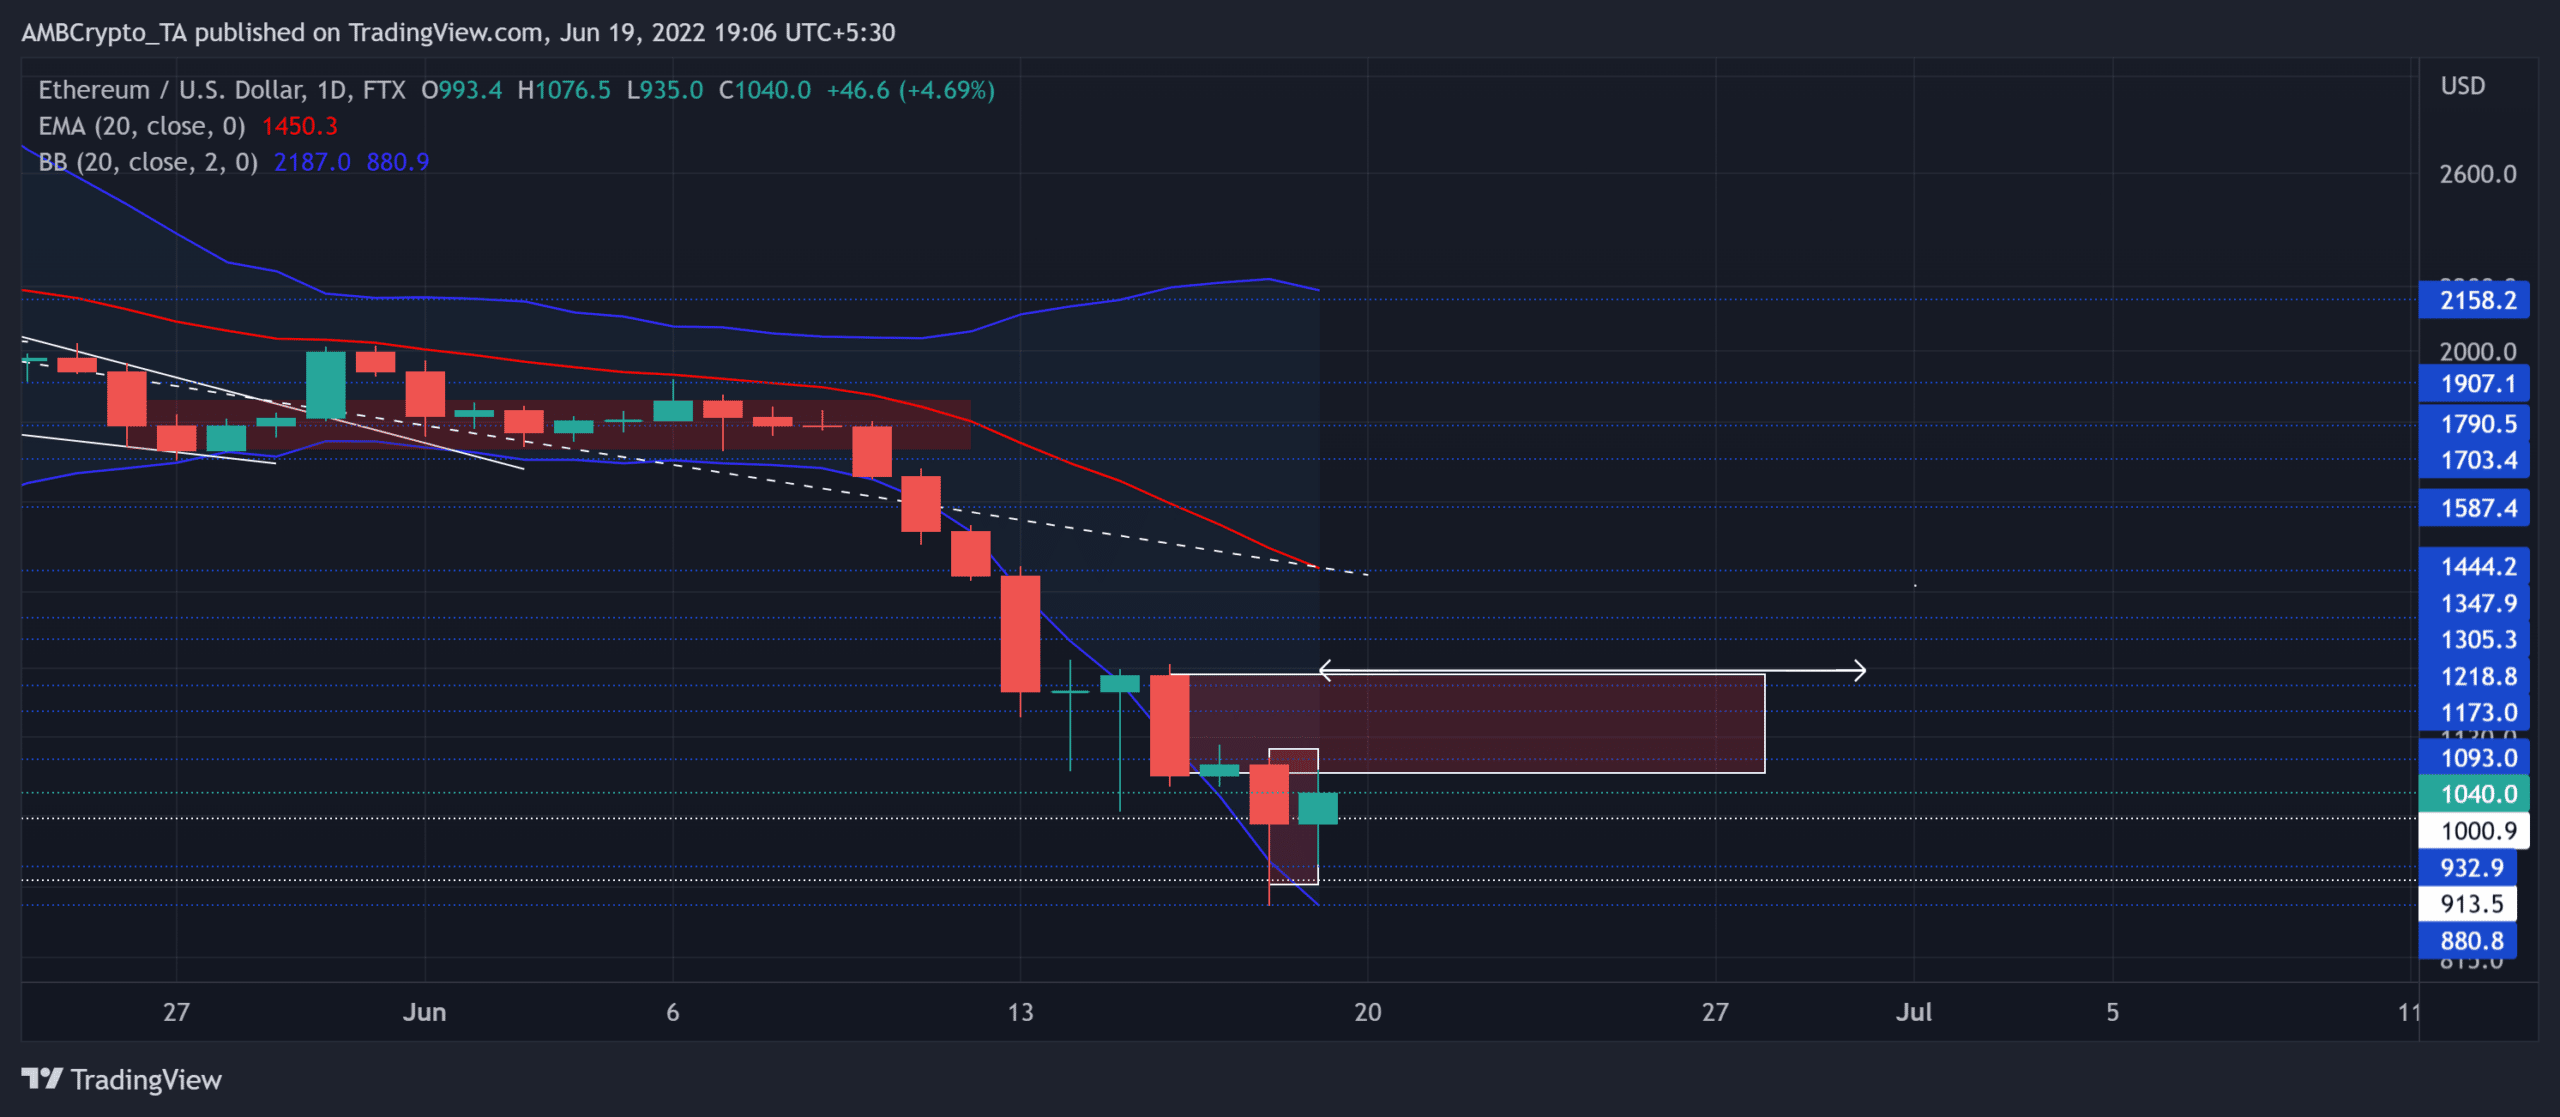
From a rather long-term outlook, the price action was quite below its 20 EMA. Historically, such a gap has warranted a revival. But, with the current macroeconomic factors in play, ETH truly walked on thin ice.
The sellers were visibly in control while the price action kept testing the lower band of the Bollinger Bands (BB) over the last week.
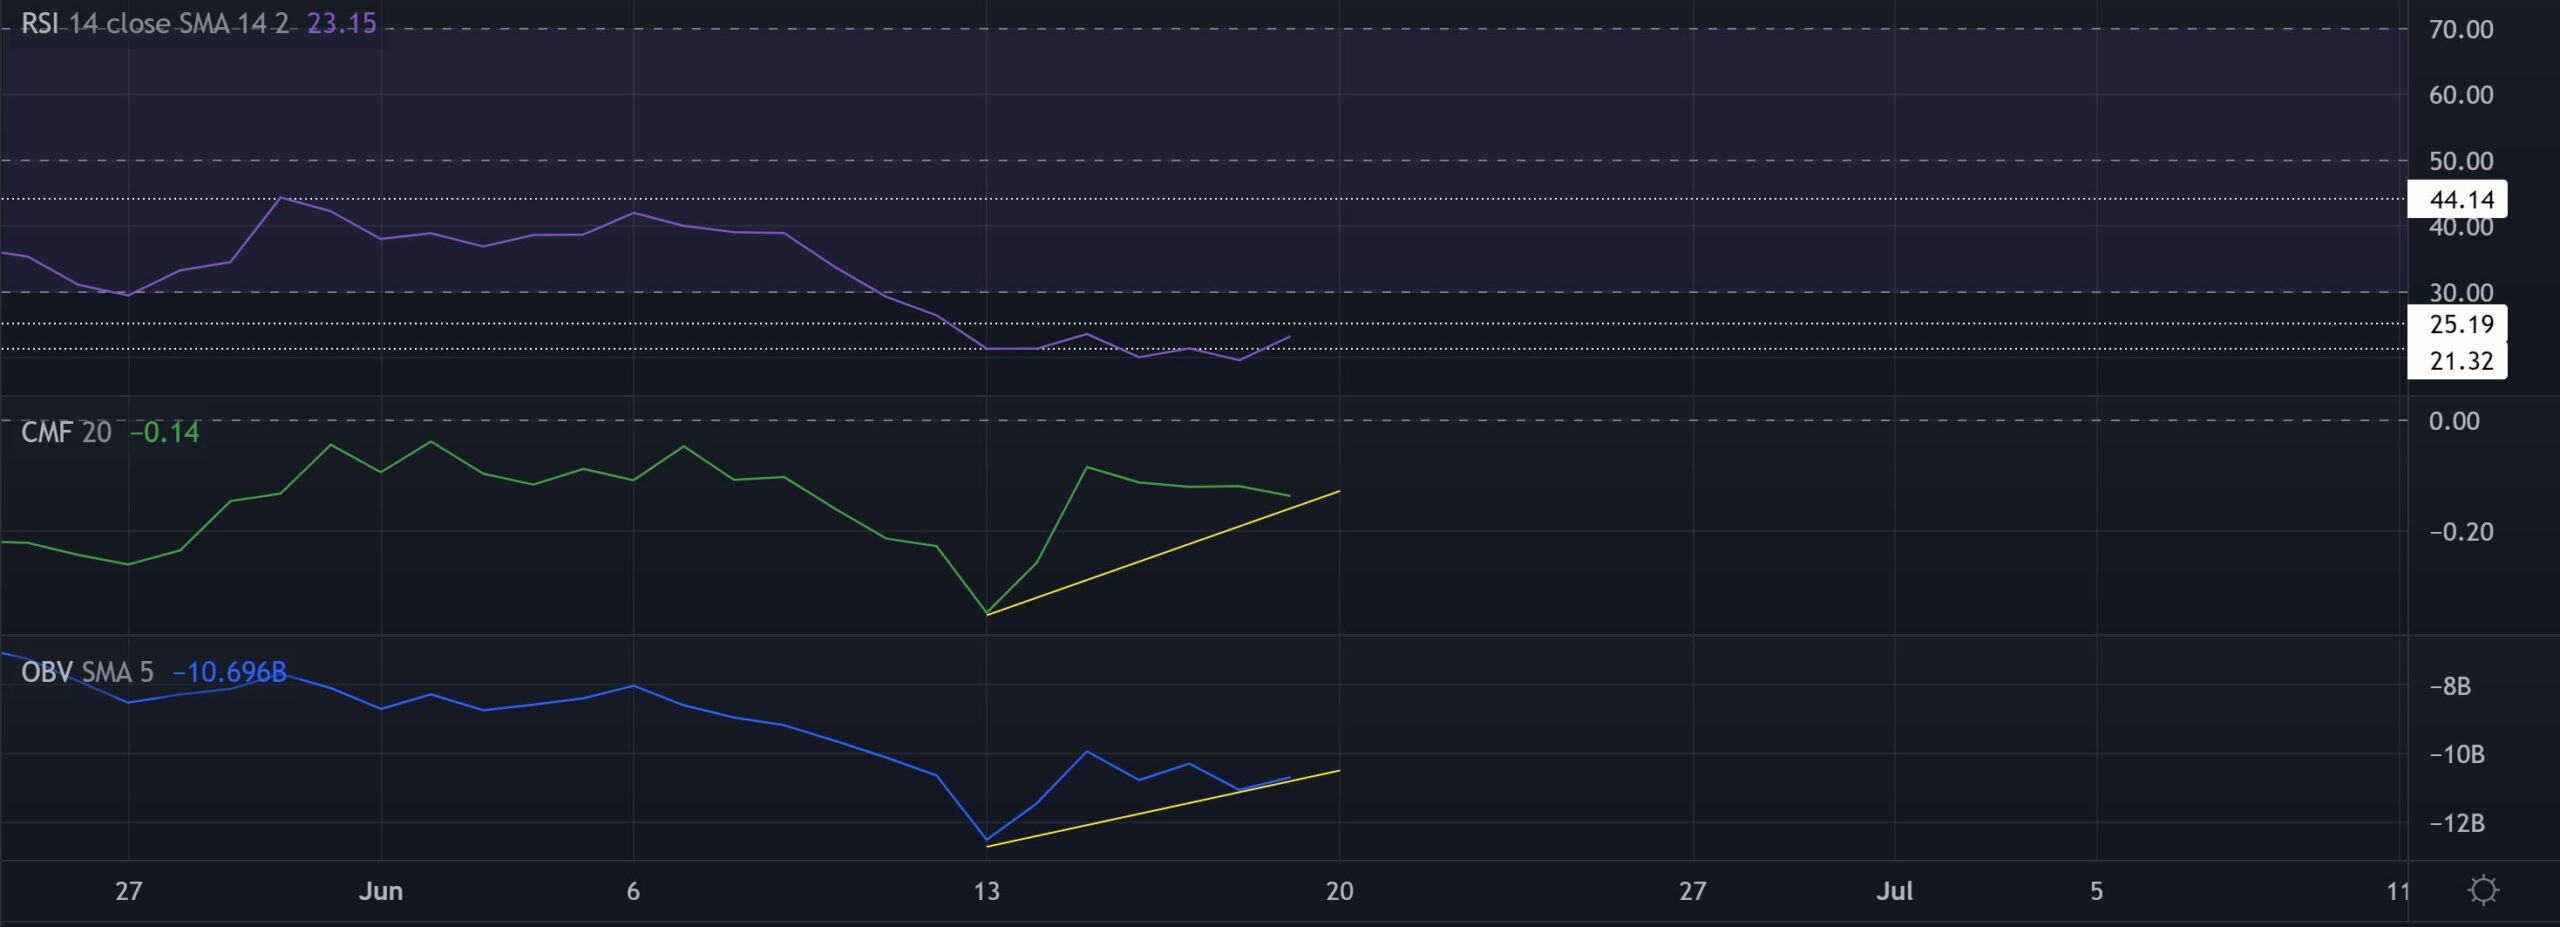
The Relative Strength Index (RSI) coincided with the price action for the most part and affirmed a one-sided bearish market. While the index swayed deep into the oversold region, the buyers would now aim to test the sturdiness of the 25-resistance.
With relatively higher troughs, the OBV and CMF have bullishly diverged with the price action over the last six days.
Conclusion
Given the bullish candlestick pattern on the H12 alongside the oversold readings and bullish divergences on the daily timeframe, ETH could test its immediate supply zone. The targets would remain the same as mentioned above.
With the fear sentiment steering the current trend, any close below the $1,000-support could lead to a retest of the $913-$930 range before a rebound. Investors/traders should consider Bitcoin’s movement and its impact on broader market perception to make a profitable move.


