Ethereum faces key $2.8K resistance – Can ETH bulls push through?
An Ethereum move to $2,880 might turn out to be a bull trap before a bearish reversal occurs.

- Ethereum maintained its bearish market structure.
- Liquidation levels indicated a potential price bounce to $2,880.
Ethereum [ETH] has fallen below the $2.8k zone, which had previously acted as a stern resistance from August to November 2024.
It was discouraging for investors to see ETH, and most of the altcoin market, lose most of their gains in November.
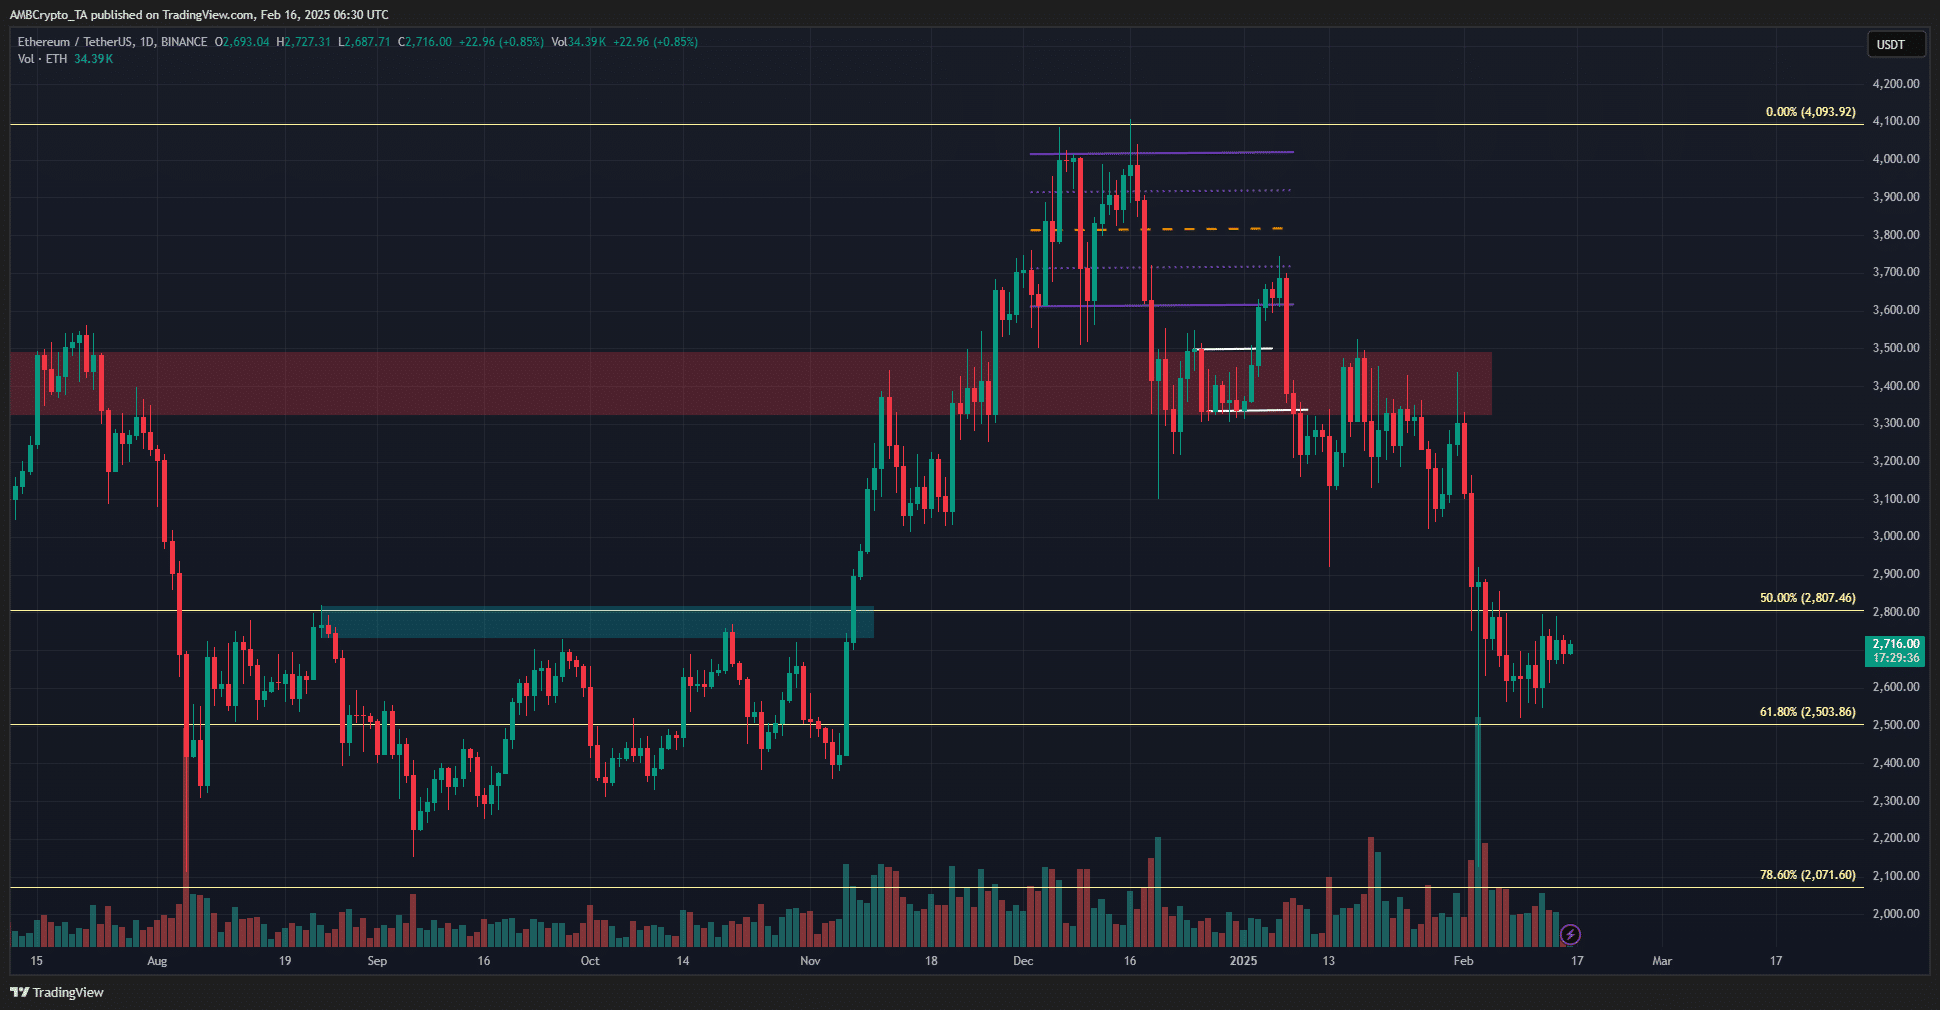
Technically, the 61.8% and 78.6% Fibonacci retracement levels continued to act as support. Yet, the daily market structure was bearish, and buying pressure has halted.
A combination of metrics and the liquidation heatmap gave clues about the next move.
The estimated leverage ratio and a potential ETH liquidity hunt
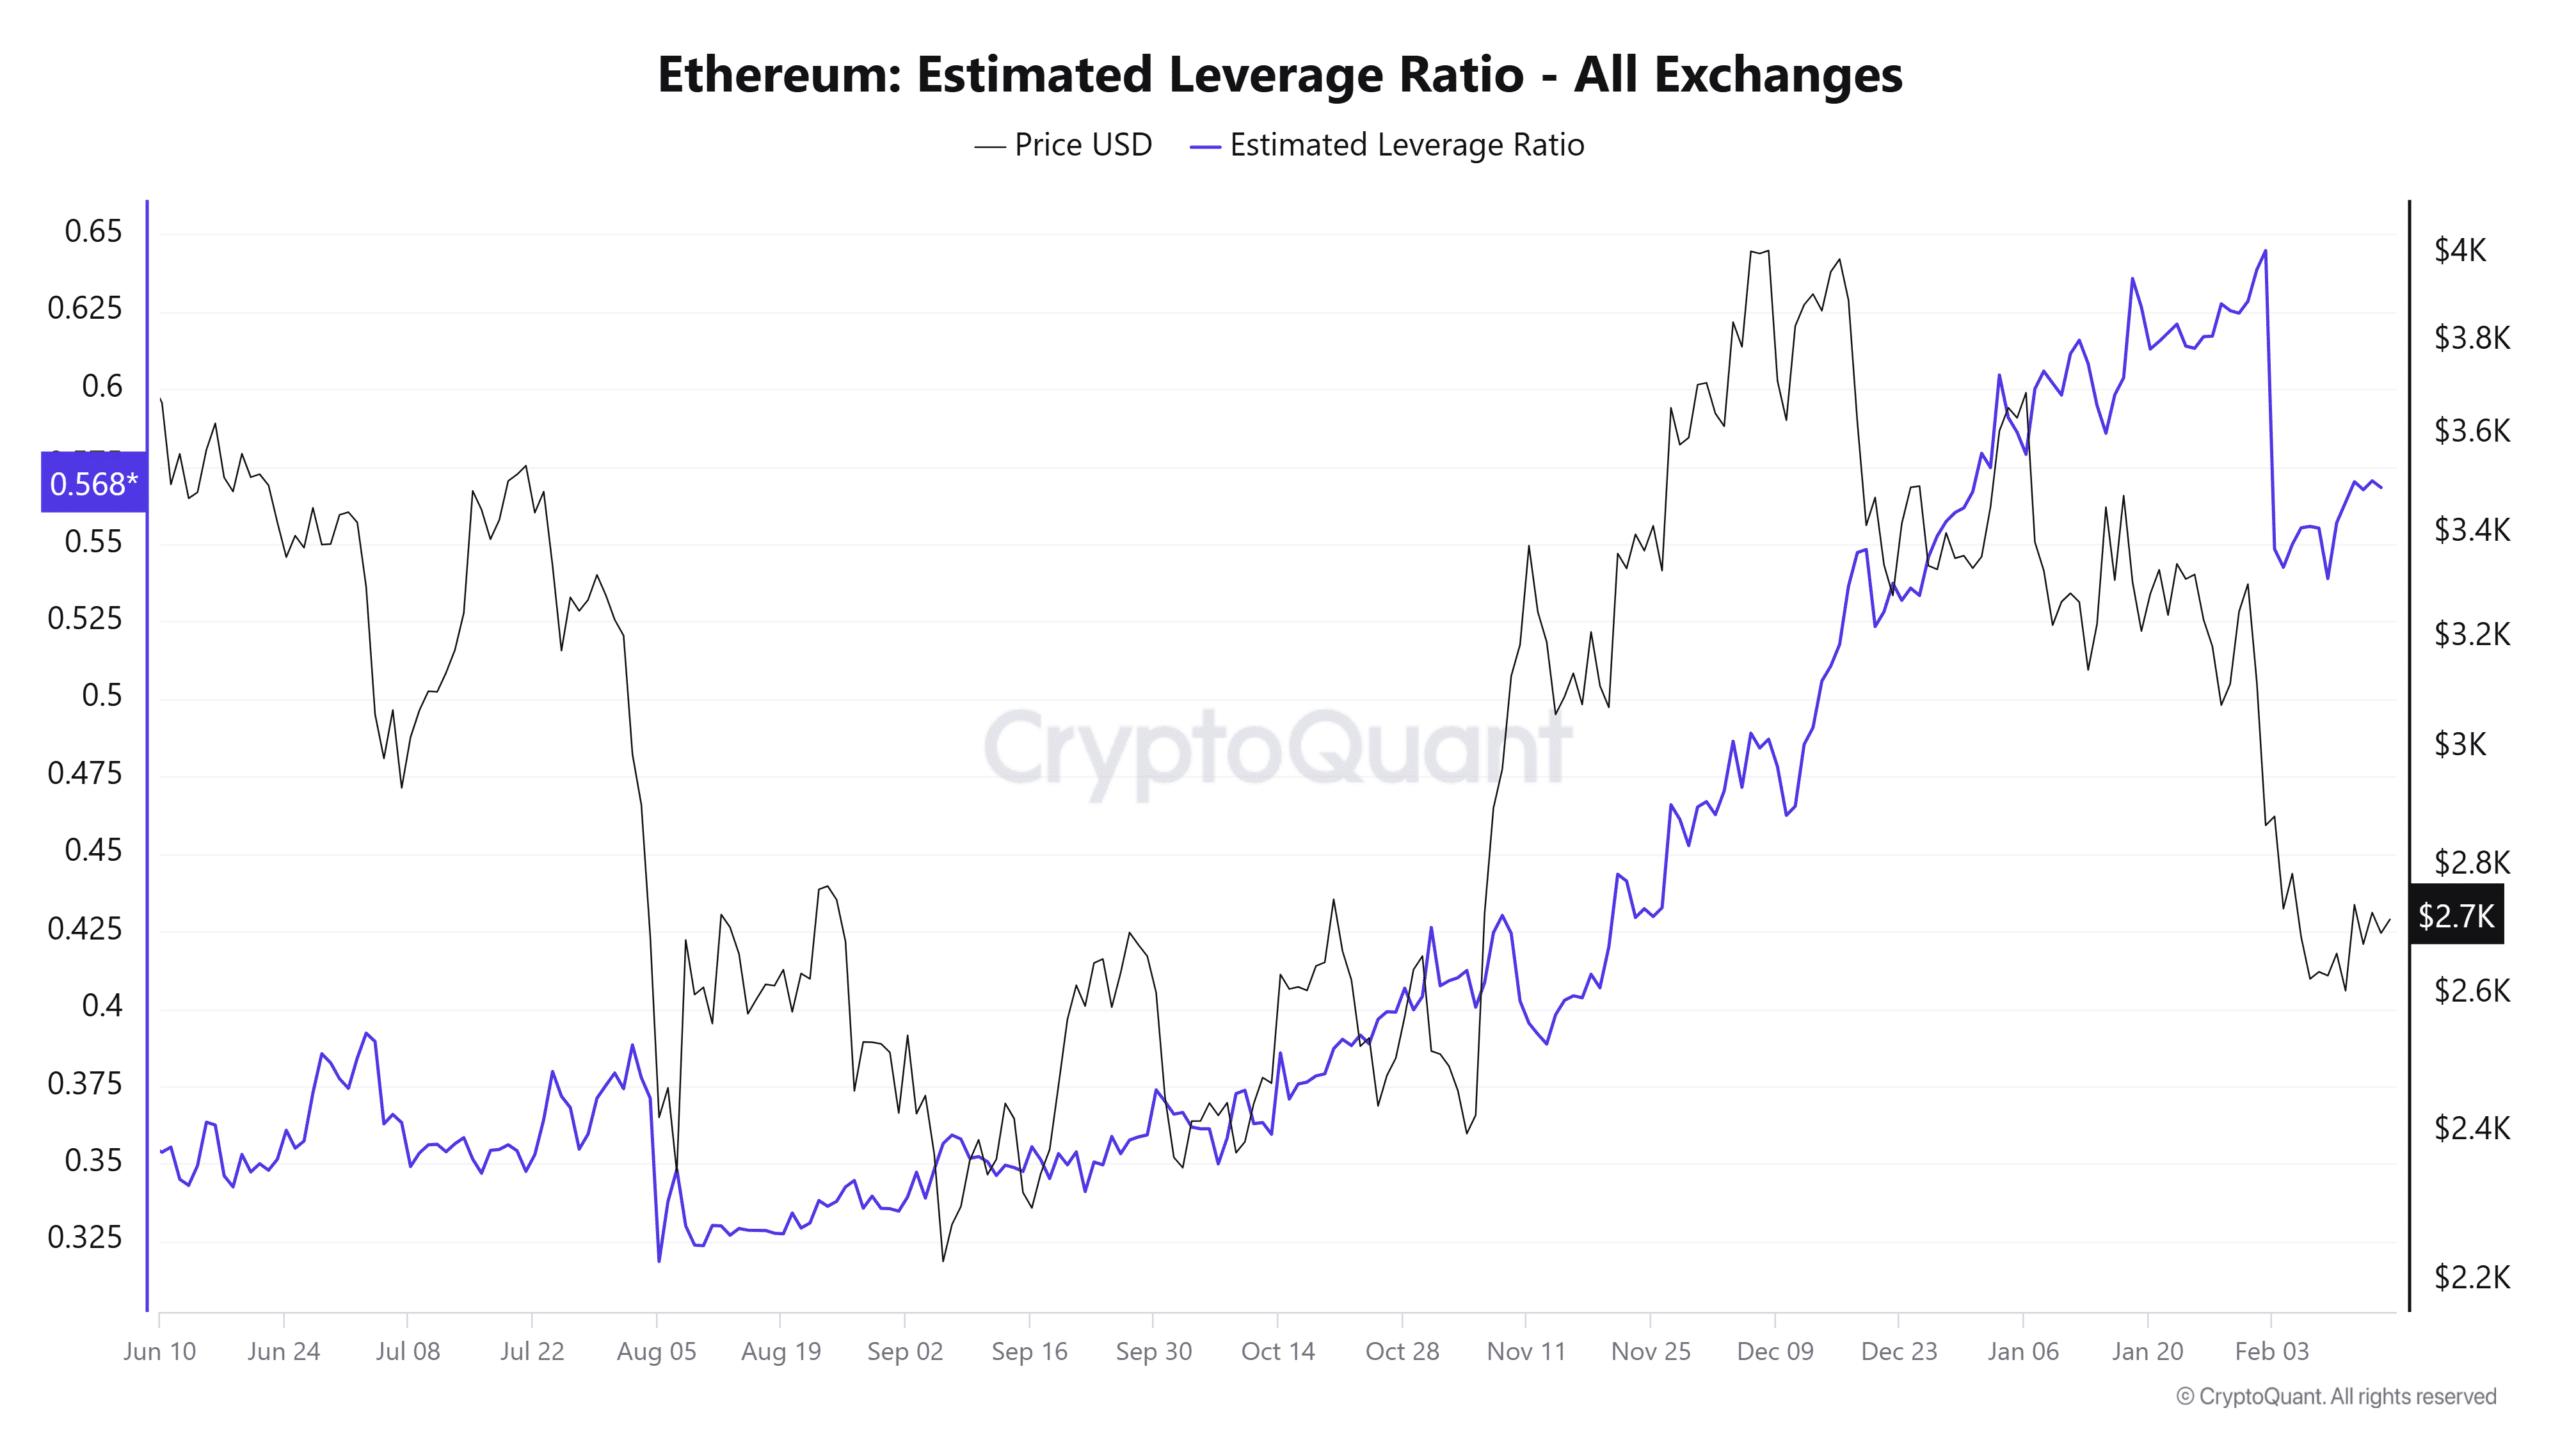
The estimated leverage ratio (ELR) is calculated by dividing the exchange’s Open Interest by its coin reserve.
The ELR is also a measure of speculative sentiment- a higher ELR implies participants are willing to assume more risks and generally indicates bullish conditions or expectations.
The swift price drop in early February halted the ELR’s uptrend, but the metric has bounced higher since then.
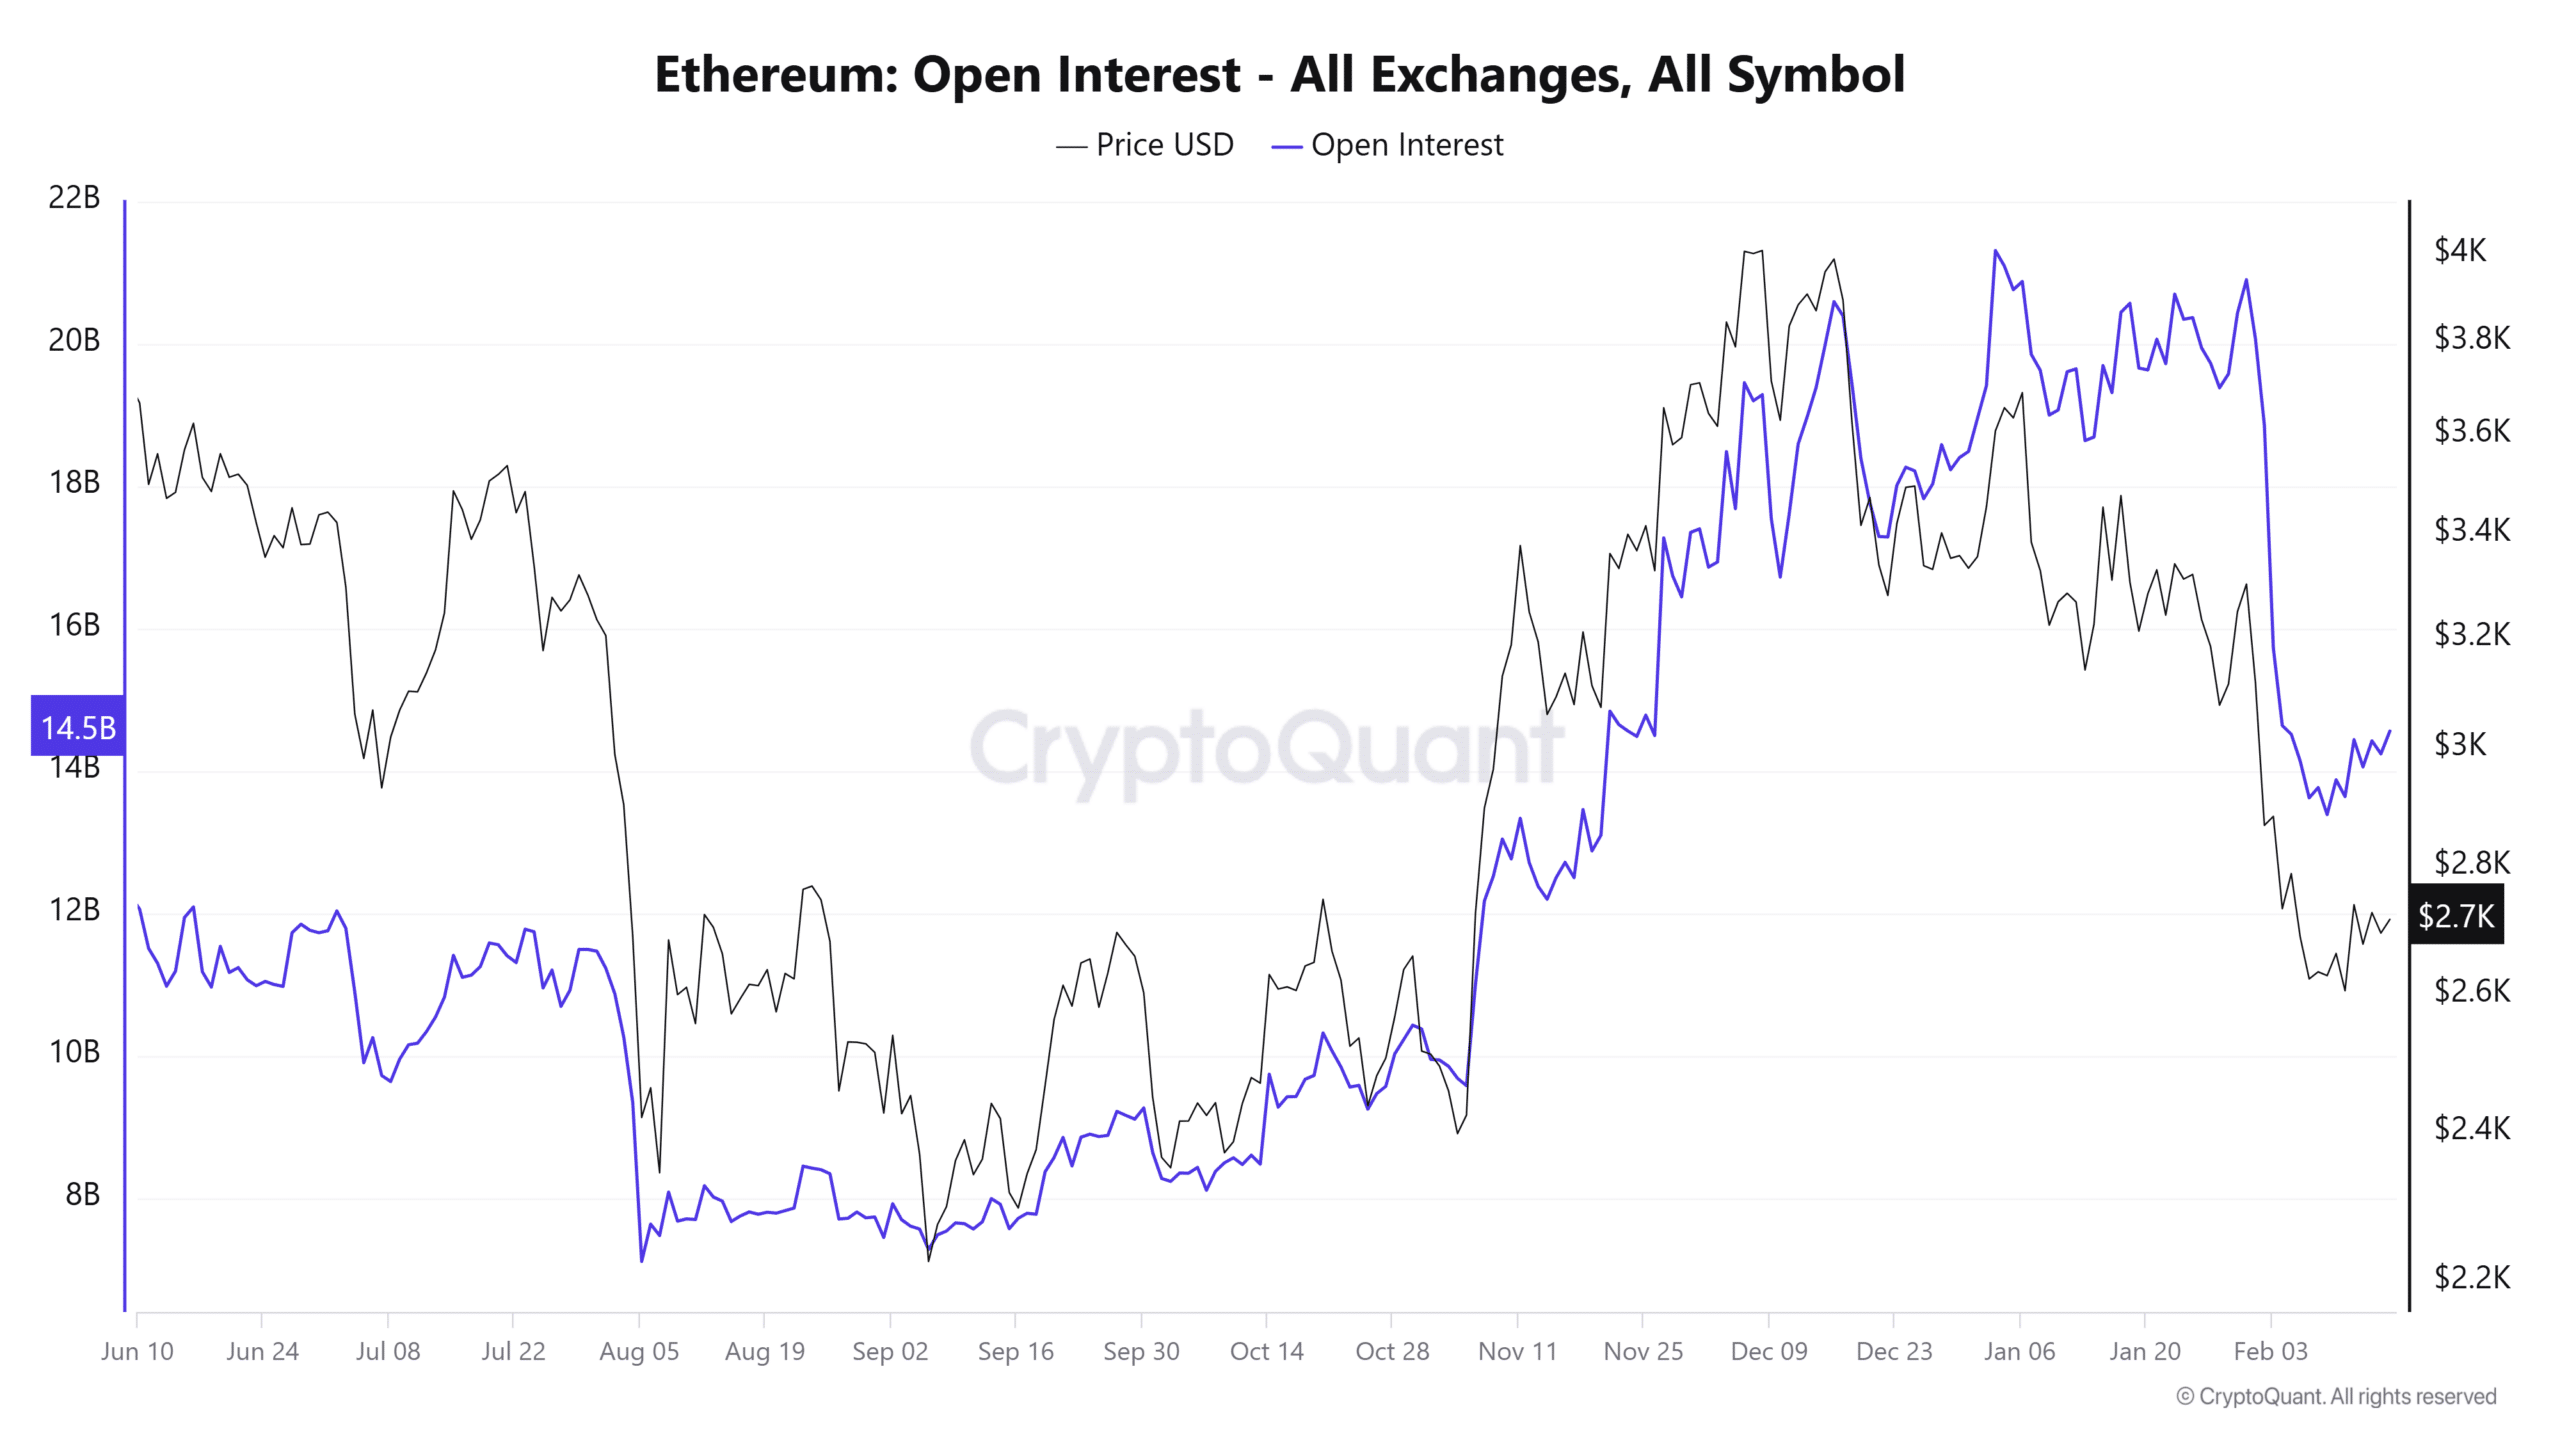
Over the past few days, Open Interest also saw a rise, going from $13.3 billion to $14.2 billion. This came alongside a price bounce from $2.5k to $2.7k.

The past two weeks also saw a large flurry of ETH movement out of exchanges. This is a bullish sign and generally shows accumulation but does not guarantee a price trend reversal by itself.
It must be remembered that ELR is OI divided by the reserve- an increased OI and decreased coin reserve will push the ELR higher.
Hence, the ELR’s inference regarding speculative expectations must be tempered. It does not negate the conclusion of short-term bullish expectations based on the OI as well as the ELR.

With this in mind, the liquidation heatmap offered another clue. There was a large pocket of liquidity around the $2.8k level. It extended from $2,800 to $2,880, marking it as a key short-term magnetic zone.
Beyond that, the $3.5k was the next target, which was much further away.
Therefore, market participants must be wary of a quick price move higher.
Ethereum’s breakout past $2.8k, since it was a major resistance in the past, would likely spark enthusiasm and increased leverage trading, but a move to $2,880 might turn out to be a bull trap before a bearish reversal occurs.