Ethereum: Failing to close above this level over the next 24 hours can have this impact

The weekend curse seemed to be lifted as buyers returned to the global cryptocurrency after losses seen on Friday and Saturday. The world’s second-largest cryptocurrency, Ethereum, noted a rise of over 8% over the last 24 hours and traded at $1,862 at the time of writing. This rise was quite a relief as losses were maintained at the 23rd May swing low of $1,720 but bulls were not in the clear just yet.
Ethereum Daily Chart
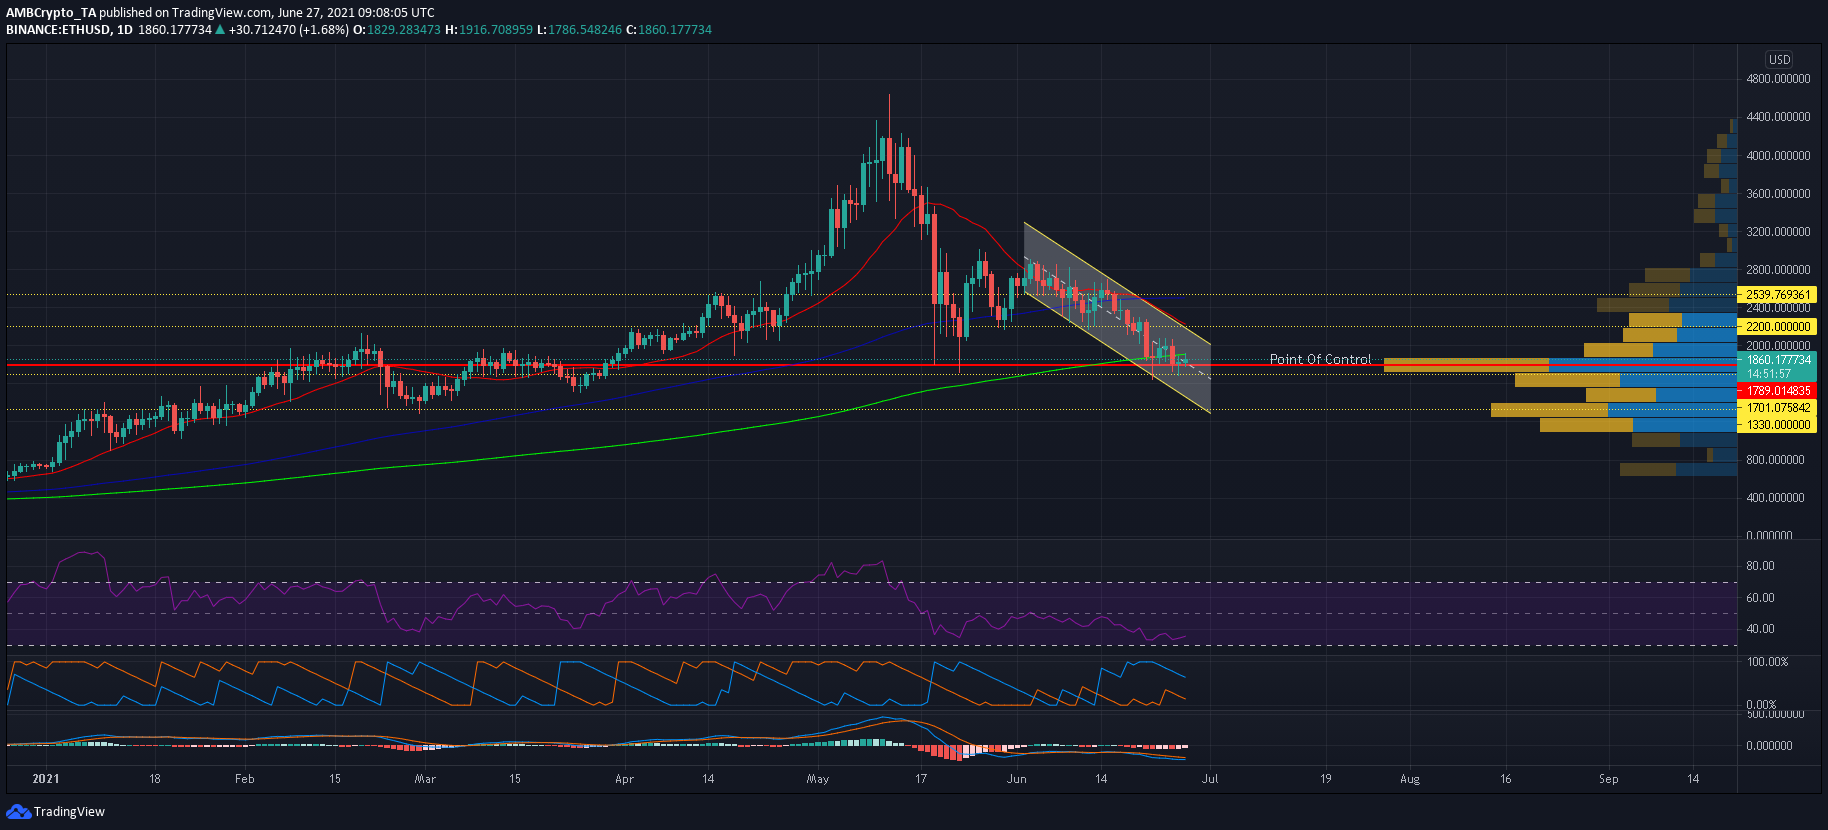
Ethereum’s price has oscillated within a descending channel over the last 25 days, forming lower highs and lows in the process. The last few days, in particular, saw the pattern test ETH’s defenses at $1,700 but the bulls managed to avoid an extended sell-off for the time being. However, the candlesticks were below their 200-SMA (green) and in uncharted territory. Failing to close above $1,900 and its long-term moving average over the next 24 hours could see bearish sentiment dictate ETH’s movement, where the threat of another decline was certainly possible.
Reasoning
Visible Range’s point on control lay around $1,730. A recent analysis also mentioned a liquidity pocket between $1,700-$,1800 and the possibility of a reversal within this zone. A down-channel breakout would see ETH rise above its daily 20-SMA (red) and push north towards $2,540- an area that clashed with the 100 SMA (blue). However, such an outcome was rather optimistic, especially since ETH was still below its daily 200-SMA.
The indicators were also less supportive of a drastic rise. Relative Strength Index, which has failed to rise above 50 for over a month, was still in bearish territory. The Aroon down maintained above the Aroon up- a sign that bearishness was still in play. The Aroon up even inched closer to 0, depicting a strong downtrend. MACD’s histogram did note receding bearish momentum but further conviction was required to support a bullish outcome.
ETH’s defensive line of $1,700 could trigger minor rallies over the coming week but sellers could return at various resistance marks highlighted on the chart. With that in mind, the focus must be at $1,700 moving forward, as a breakdown might thwart prices back to early March levels of $1,330. The Visible Range showed a strong level of interest for ETH at this point which could match up to the selling pressure.
Conclusion
Ethereum’s defensive line of $1,700 had the potential to trigger a down-channel breakout but the indicators were not yet supportive of such an outcome. The region was also vulnerable to a breakdown, and a close below $1,700-1,650 might open the doors for a sharper retracement.


