Ethereum, IOTA, Dogecoin Price Analysis: 07 March

Ethereum regained the $1,600 level as buying picked up, but the bulls faced a key test at the $1,676 resistance point. IOTA moved against the broader market trends and traded in the red as the bears targeted the crucial 50% Fibonacci retracement level. Lastly, DOGE moved within a descending triangle but a breakdown seemed unlikely moving foward
Ethereum [ETH]
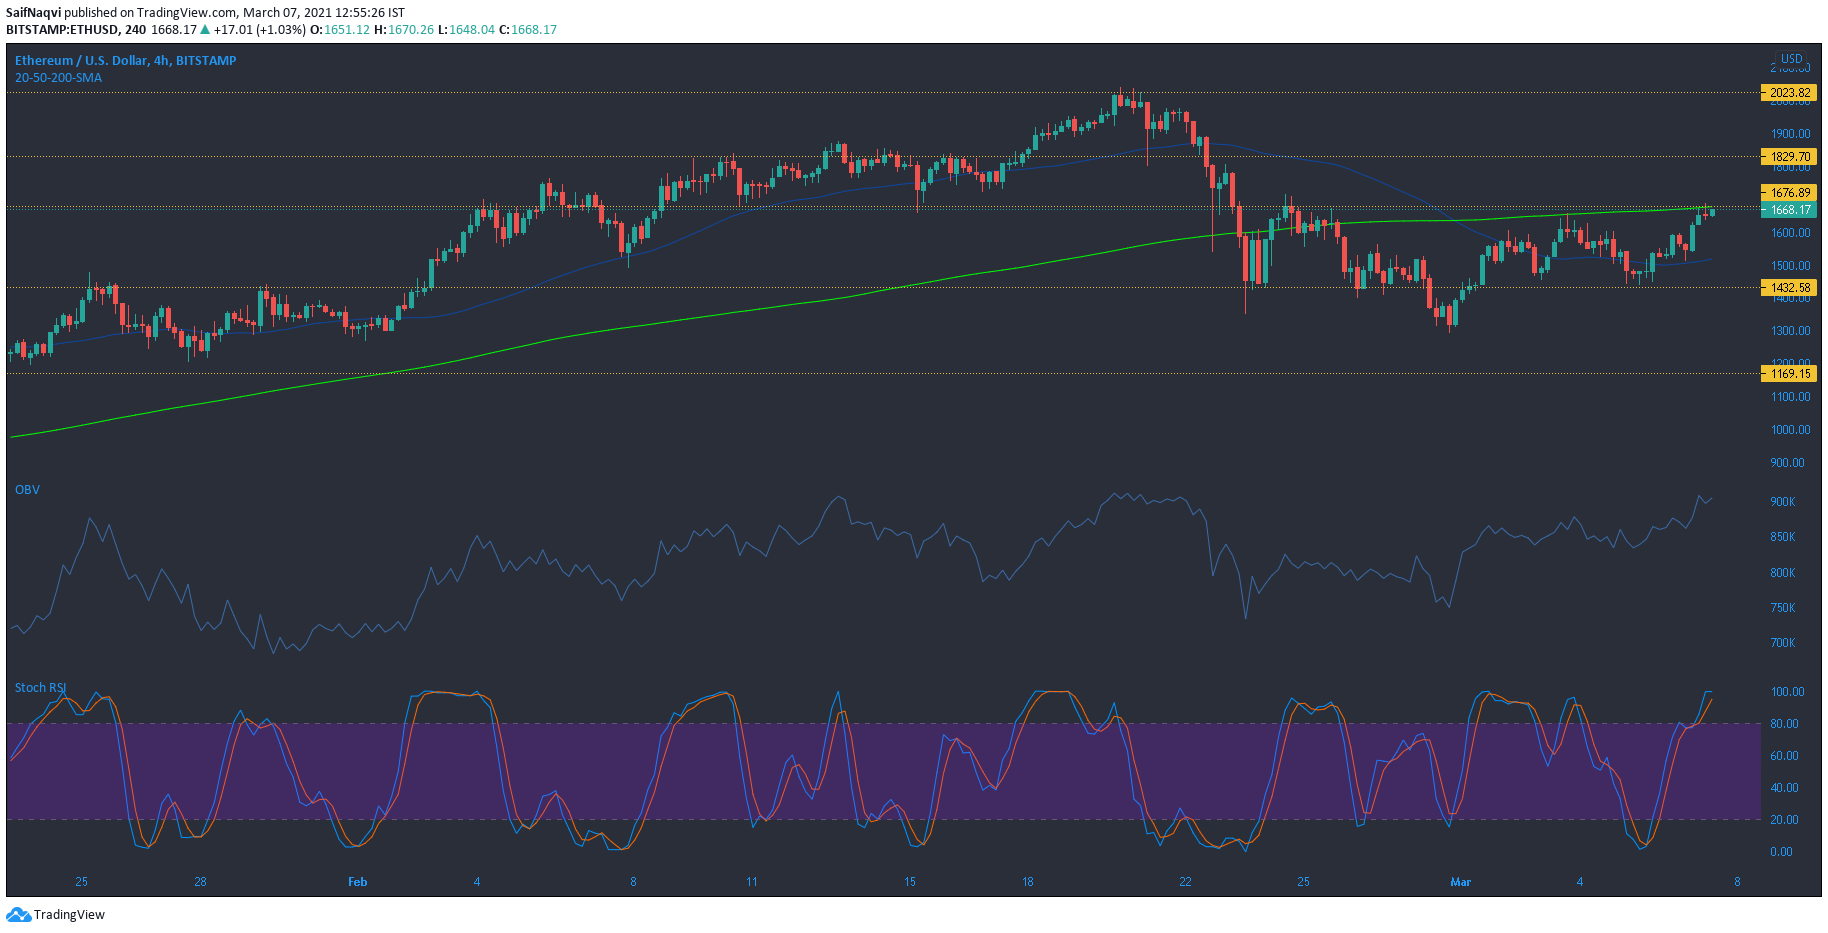
A rise of over 7% in the last 24 hours helped Ethereum recapture the $1,600 mark from the bears. The On Balance Volume formed higher highs over the past few sessions as buying activity picked up on the world’s largest altcoin. The next challenge for the bulls lay at the $1,676 resistance mark, which also coincided with the 200-SMA.
Successfully breaking above the long-term moving average could give ETH a psychological boost and the bulls could target the $1,8oo mark. On the other hand, the Stochastic RSI traded in the overbought zone and suggested that ETH was due for a pullback moving forward. In such a case, support at $1,432 could likely contain the price from moving south.
IOTA
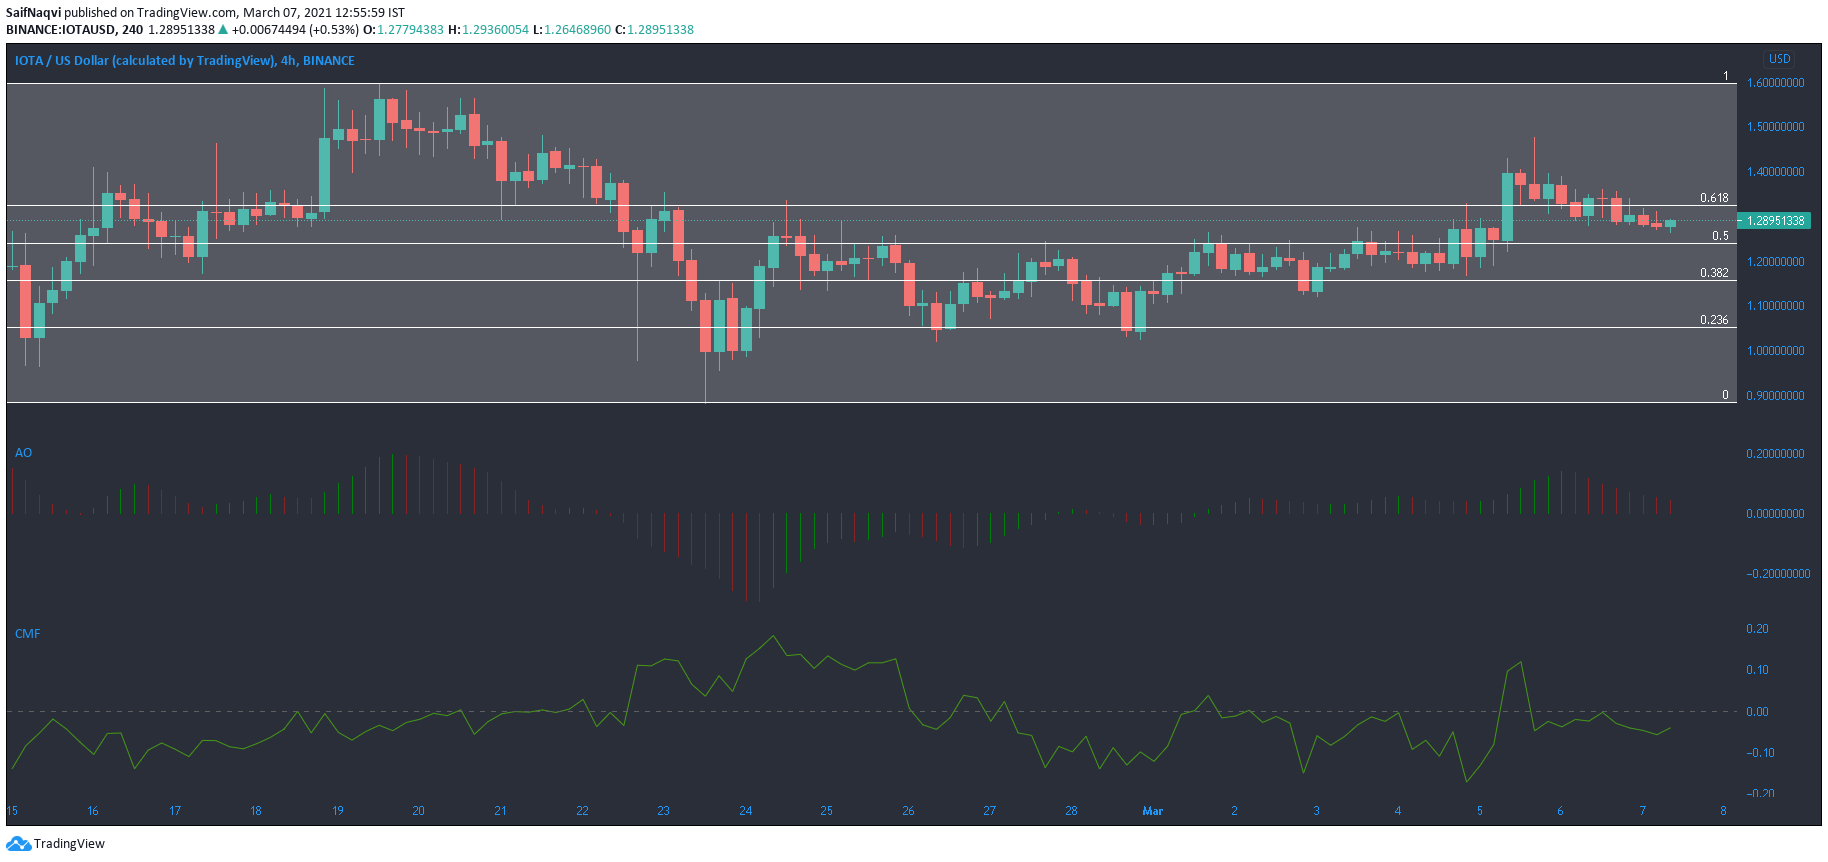
Bucking the broader market trend, IOTA flashed red at press time as the sell-off continued from the $1.40 level. The bulls conceded the 61.8% Fibonacci retracement level as momentum increased on the selling side. The same was captured by the Awesome Oscillator’s red bars, which moved towards the half-way mark. However, the next Fibonacci level could be detrimental to IOTA’s short-term price.
A move below the 50% Fibonacci retracement level could lead to an extended bearish situation for IOTA. If the bulls defend the aforementioned mark, a bullish bounce back could be on the cards. The Chaikin Money Flow showed the some of the capital that escaped IOTA’s market was moving back towards the cryptocurrency as the index pointed north, towards the half-line.
Dogecoin [DOGE]
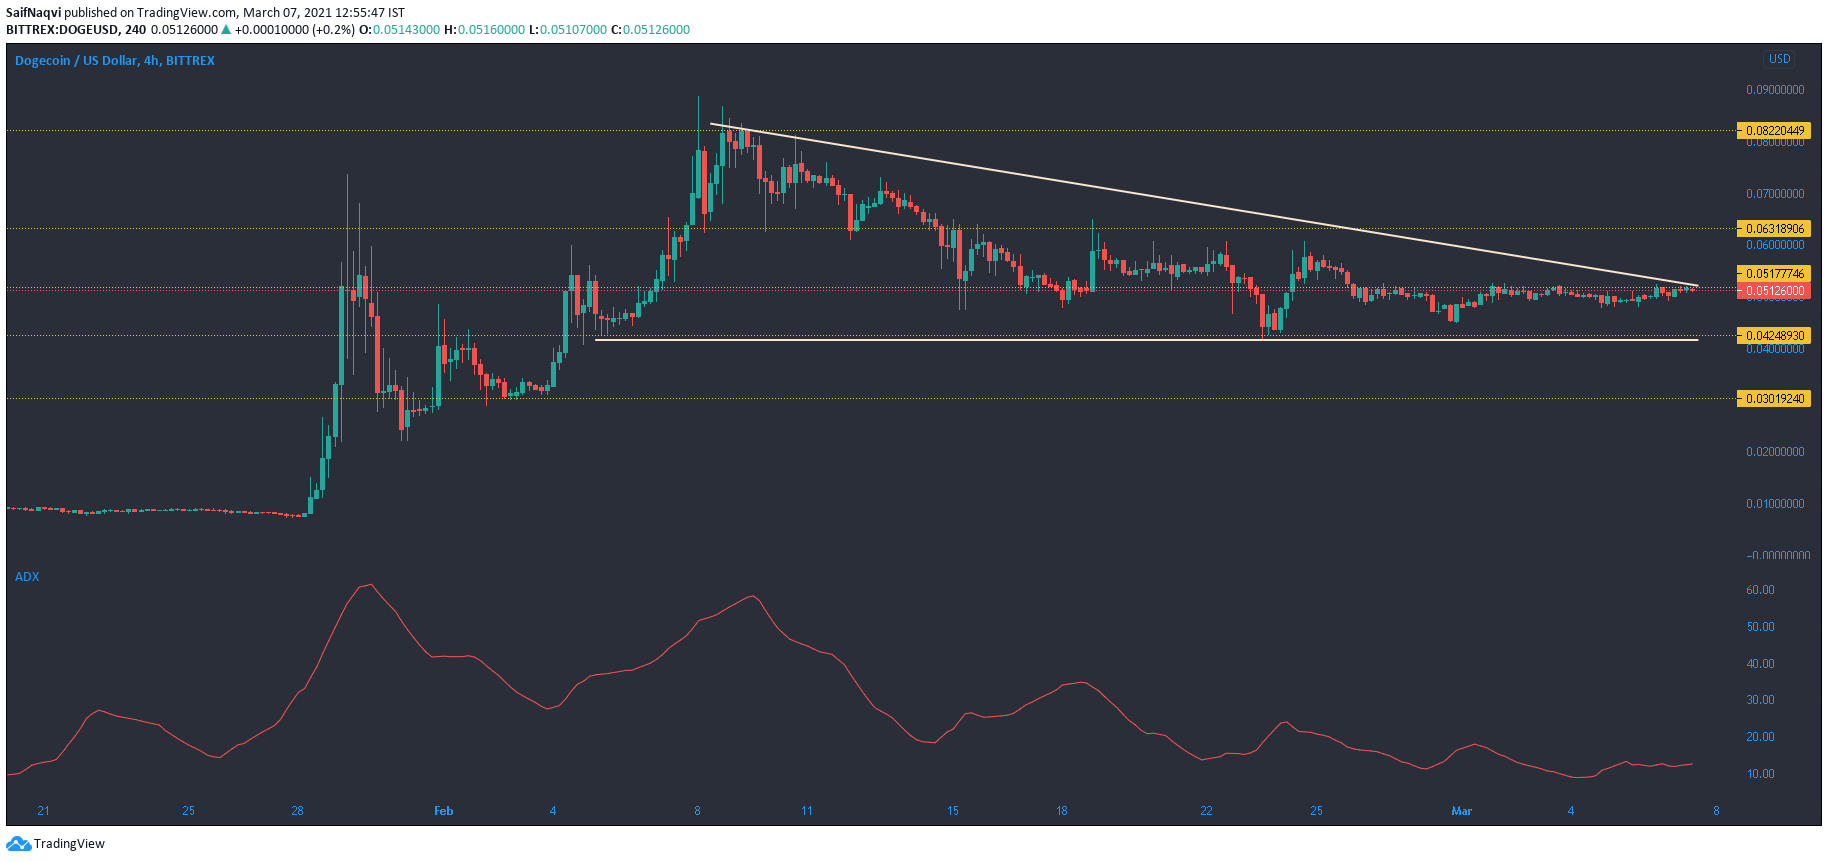
A descending triangle formed on Dogecoin’s 4-hour chart, categorized by lower highs and steady lows. Although the price usually follows a breakdown from the pattern, DOGE’s distribution phase could last for an extended duration as the broader market lacked a clear direction. The ADX Indicator rested at the 13-mark and showed the absence of a strong trend in the market. This also meant that large price swings were unlikely in the coming sessions.
If the breakdown occurred sooner than expected, support at $0.03 could be under the spotlight. Traders would also have the option of going long from this mark onwards.


