
The month of June has been rocky for the crypto-market, especially after two substantial market crashes last month and this month. The trend specifically observed in the case of most cryptos was that they broke past their crucial support levels and then traded above it only to fall through the key support levels again.
Ethereum, IOTA, and Zcash recovered somewhat over the last few days, however, all three coins were trading in the red again near their key support levels.
Ethereum [ETH]
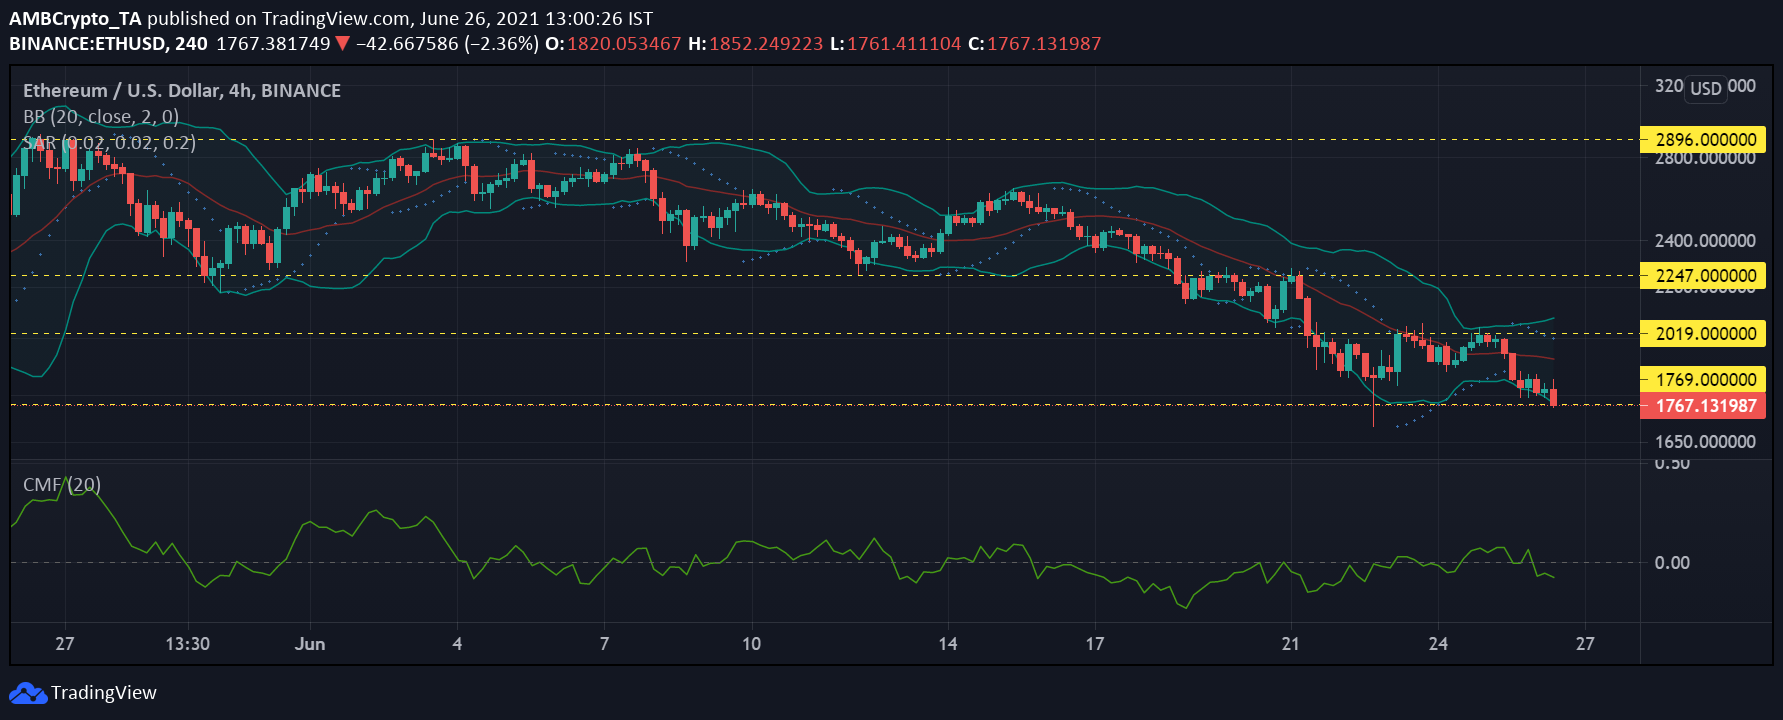
ETH/USD, TradingView
Ethereum witnessed a brief price correction a day back, however, it was back to trading in the red at press time. The altcoin breached its crucial support level of $2019 on 21 June but since then, it has traded below that support level. At the time of writing, the coin had registered a new low of $1768, which if compared to the prices last month marked a 39% fall.
The Parabolic SAR pictured a downtrend at press time, a sign that ETH might continue falling over the upcoming trading sessions.
The Chaikin Money Flow suggested that even though capital inflows had picked up slightly over the last week, capital outflows were still greater than inflows over the past 24 hours. The mouth of the Bollinger Bands had widened on 25 June and it continued to demonstrate further widening at press time – A sign of further price volatility.
IOTA
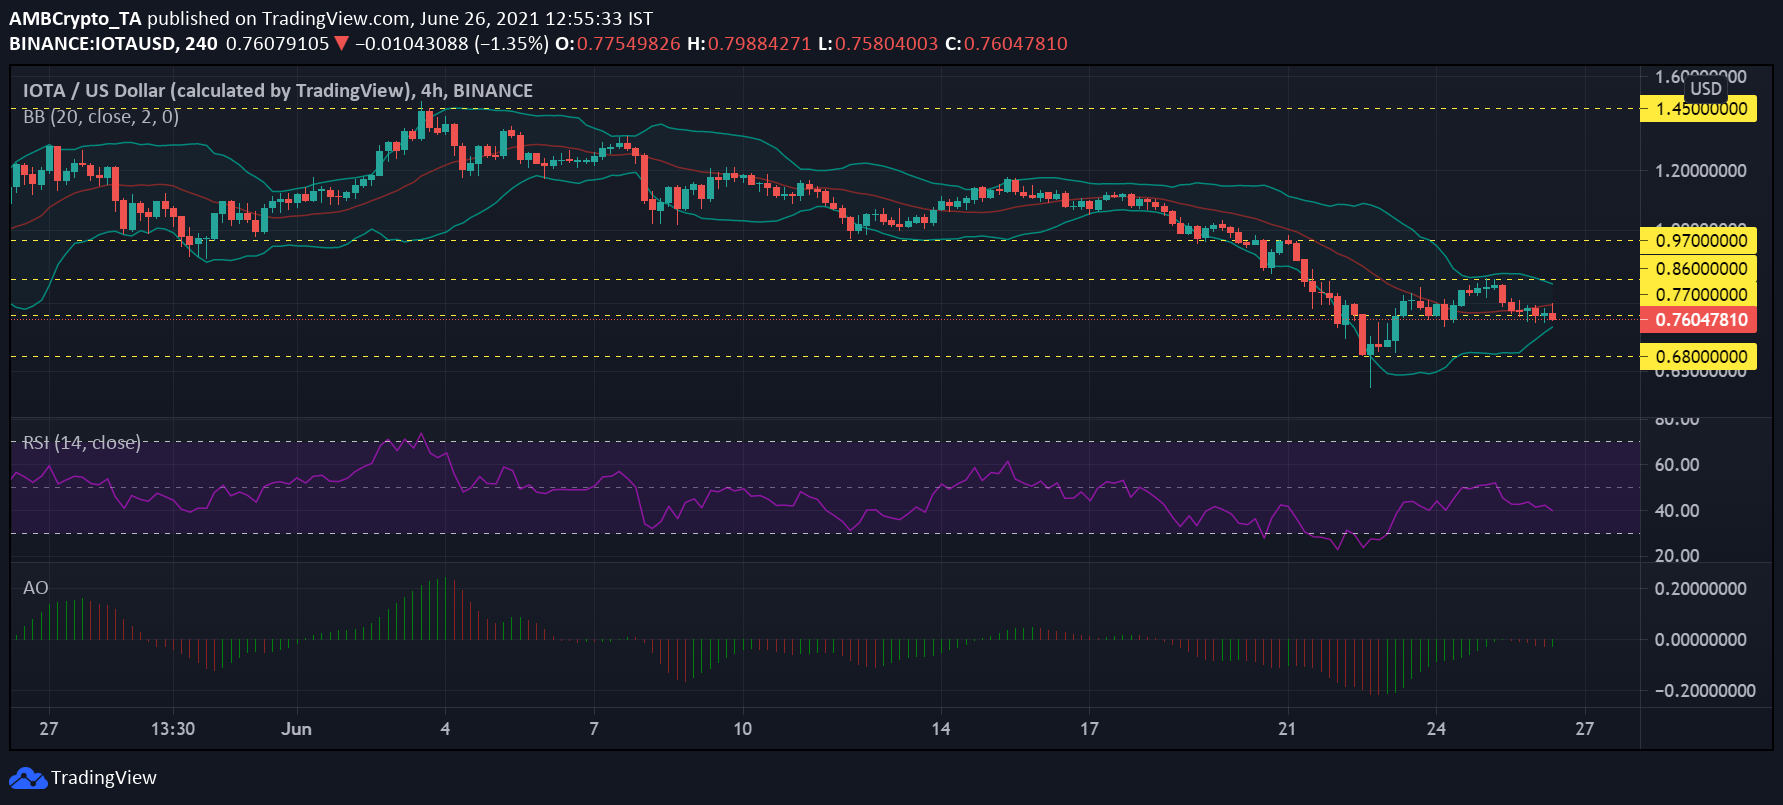
IOTA/USD, TradingView
IOTA broke past its key support level of $0.77 a week back. However, last week itself, the price moved up north after the alt touched the $0.68-mark. The alt had recovered and was trading above its key support level of $0.77 after 23 June, alas, at press time, IOTA had once again fallen past it.
The coin’s valuation has fallen by 48% since the beginning of this month. At the time of writing, it was priced at $0.76, and with a further dip in price, the next support level would be at $0.68. If the price goes north, the crypto could note resistance at $0.86. Price fluctuations, however, seemed unlikely as the Bollinger Bands were constricted at press time.
The asset was falling south from the neutral zone as it noted a hike in selling pressure, according to the Relative Strength Index. With visible red bars on the Awesome Oscillator, the alt highlighted the beginning of a bearish signal.
Zcash [ZEC]
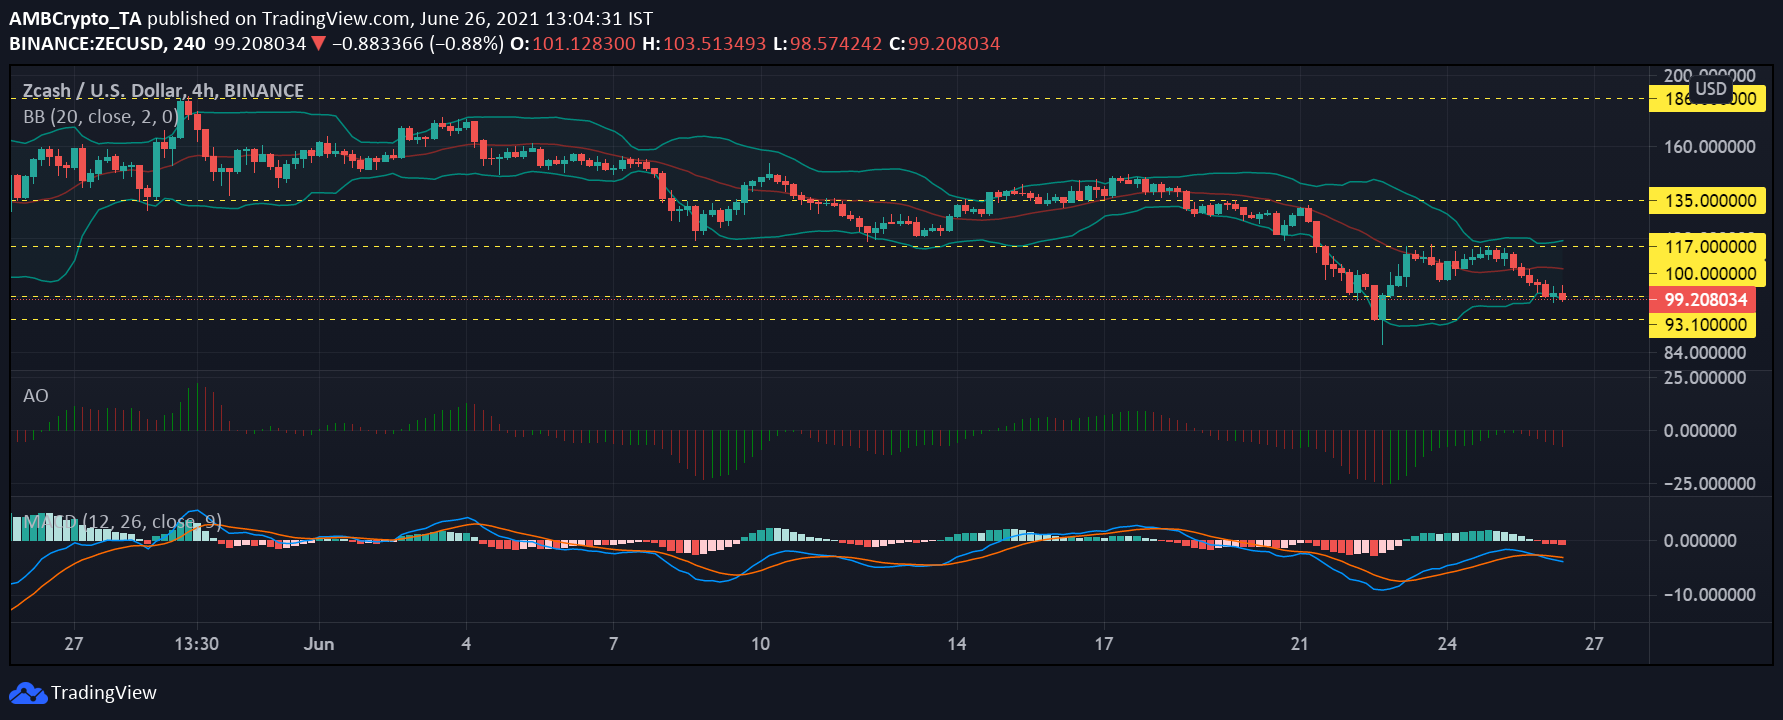
ZEC/USD, TradingView
ZEC swung between the $100 support and $117 resistance after it fell to $93.10 on 22 June. At press time, the altcoin was trading in the red at $99.20 after it breached its $100 support level. After a week of steady recovery, the coin fell by 14% and if it continues to fall further, the next support level for the coin would be $93.
Bollinger Bands depicted a tiny divergence at press time, which meant that the price could see some volatility over the next few trading sessions. The Awesome Oscillator underlined bearish momentum after a week of the bullish signals on the charts.
The MACD line pictured a bearish crossover on 25 June and at press time, the bears had taken over the market.