Ethereum-linked coins take the lead as altcoin market rallies
Ethereum-related assets ENS and ETC are leading the altcoin rally in the last 24 hours.

- The altcoin market has witnessed significant growth in the last 24 hours.
- ETC and ENS have seen their values rise by double digits.
The cryptocurrency market is experiencing a significant surge following the landmark approval of spot Bitcoin ETFs. This long-awaited decision has led to a widespread rally in the values of several assets.
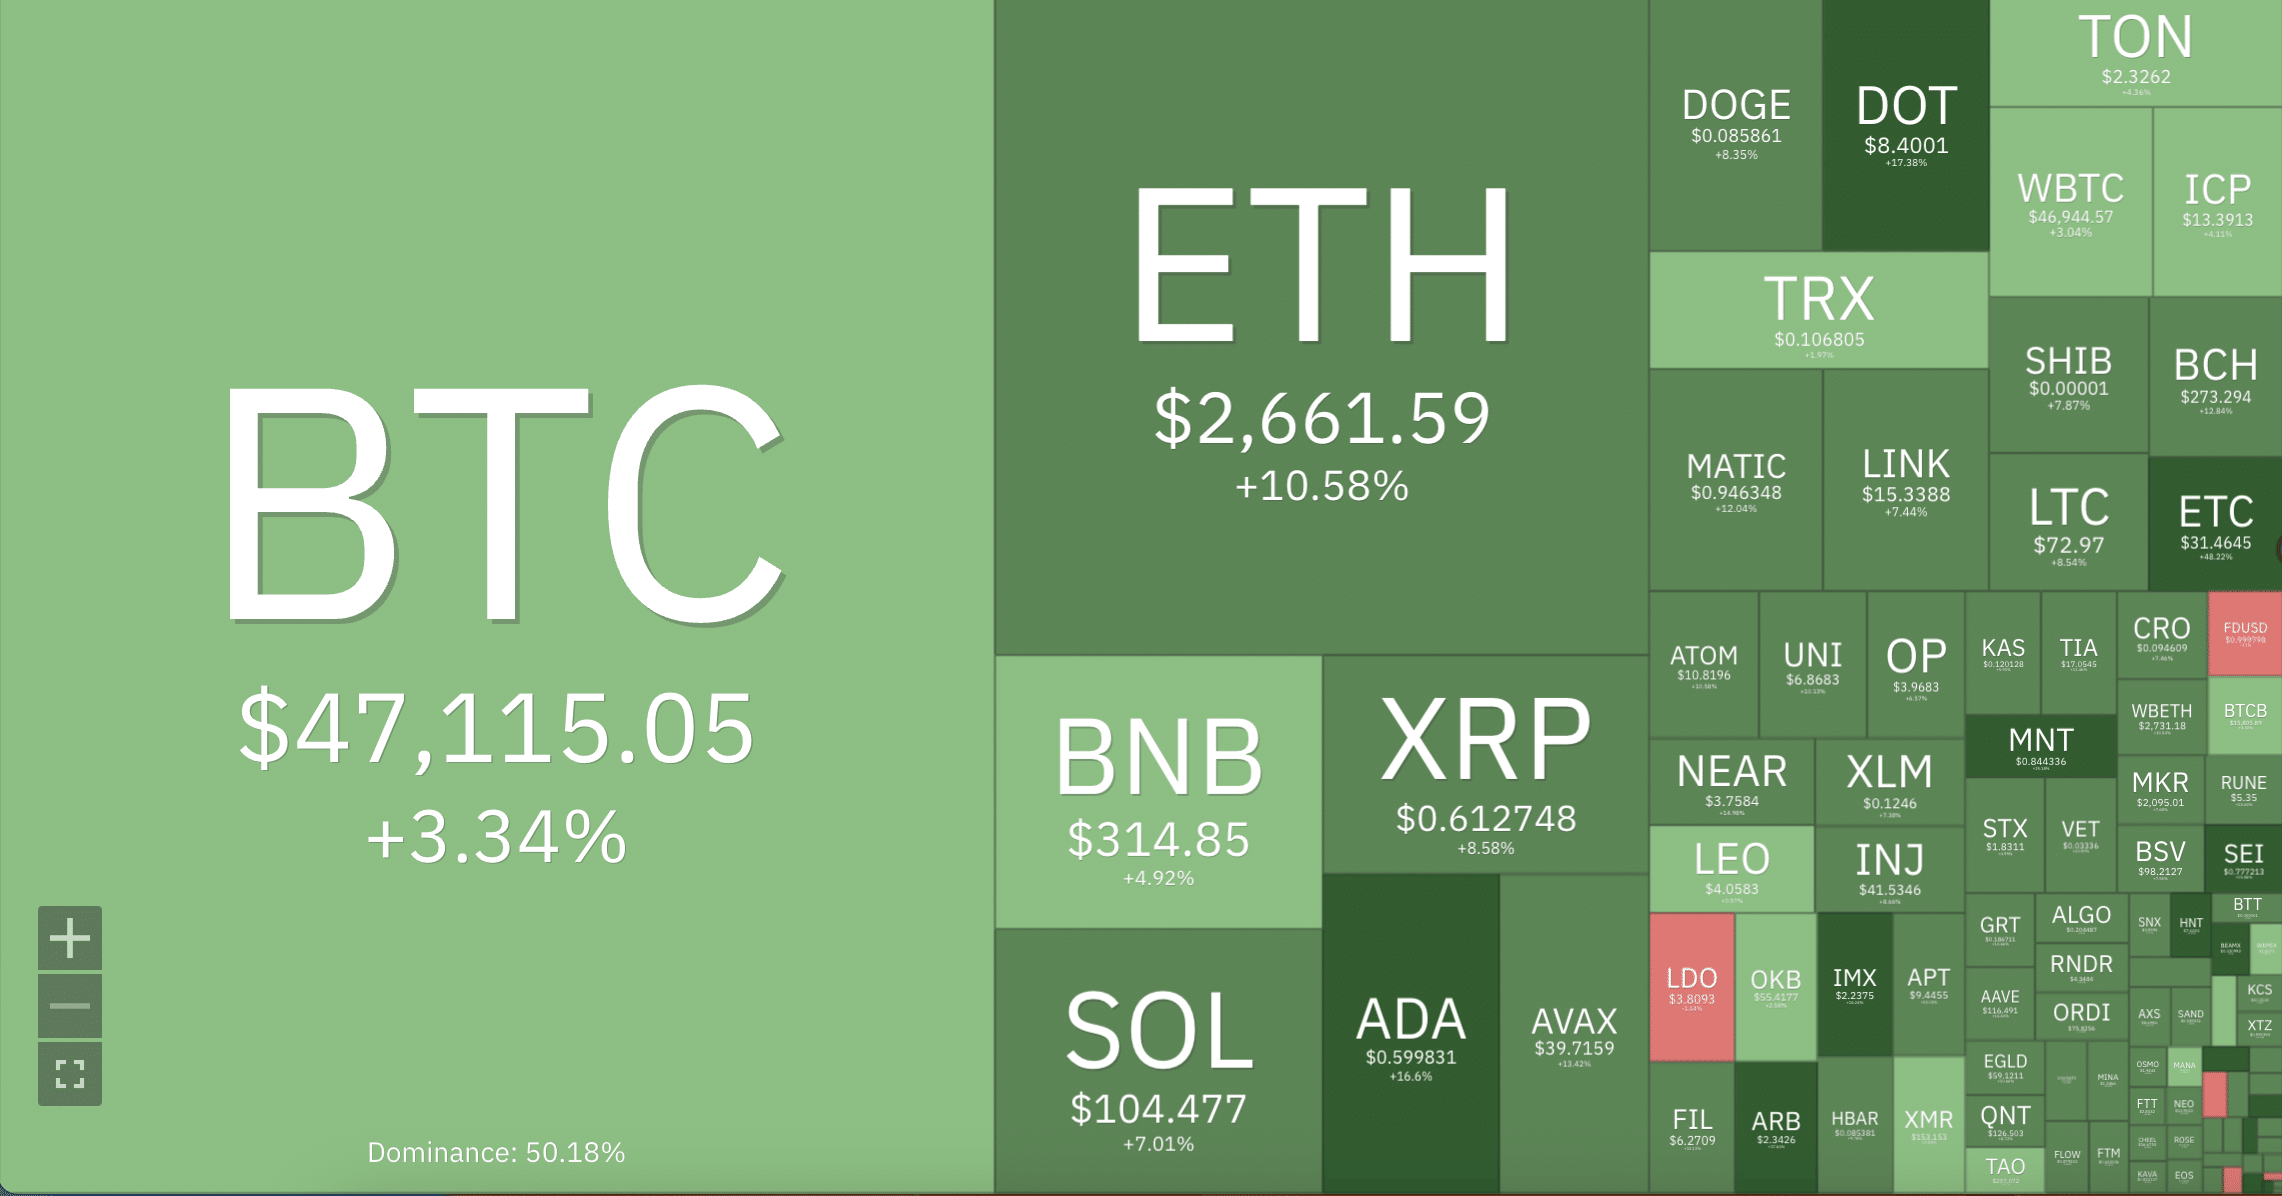
Ethereum-linked tokens Ethereum Classic [ETC] and Ethereum Name Service [ENS] have led the charge in this rally, rising to their highest price levels in over 12 months.
ETC has seen its price jump by over 47% in the past 24 hours, while ENS has climbed by 37%, according to data from CoinMarketCap.
Both assets have also seen a spike in trading volume in the past 24 hours. ENS’s trading volume totaled $504 million during that period, rising by 200%.
Regarding ETC, its trading volume has risen by over 250%, totaling $2.16 billion, its highest since September 2022, AMBCrypto found.
The price rally comes at a price
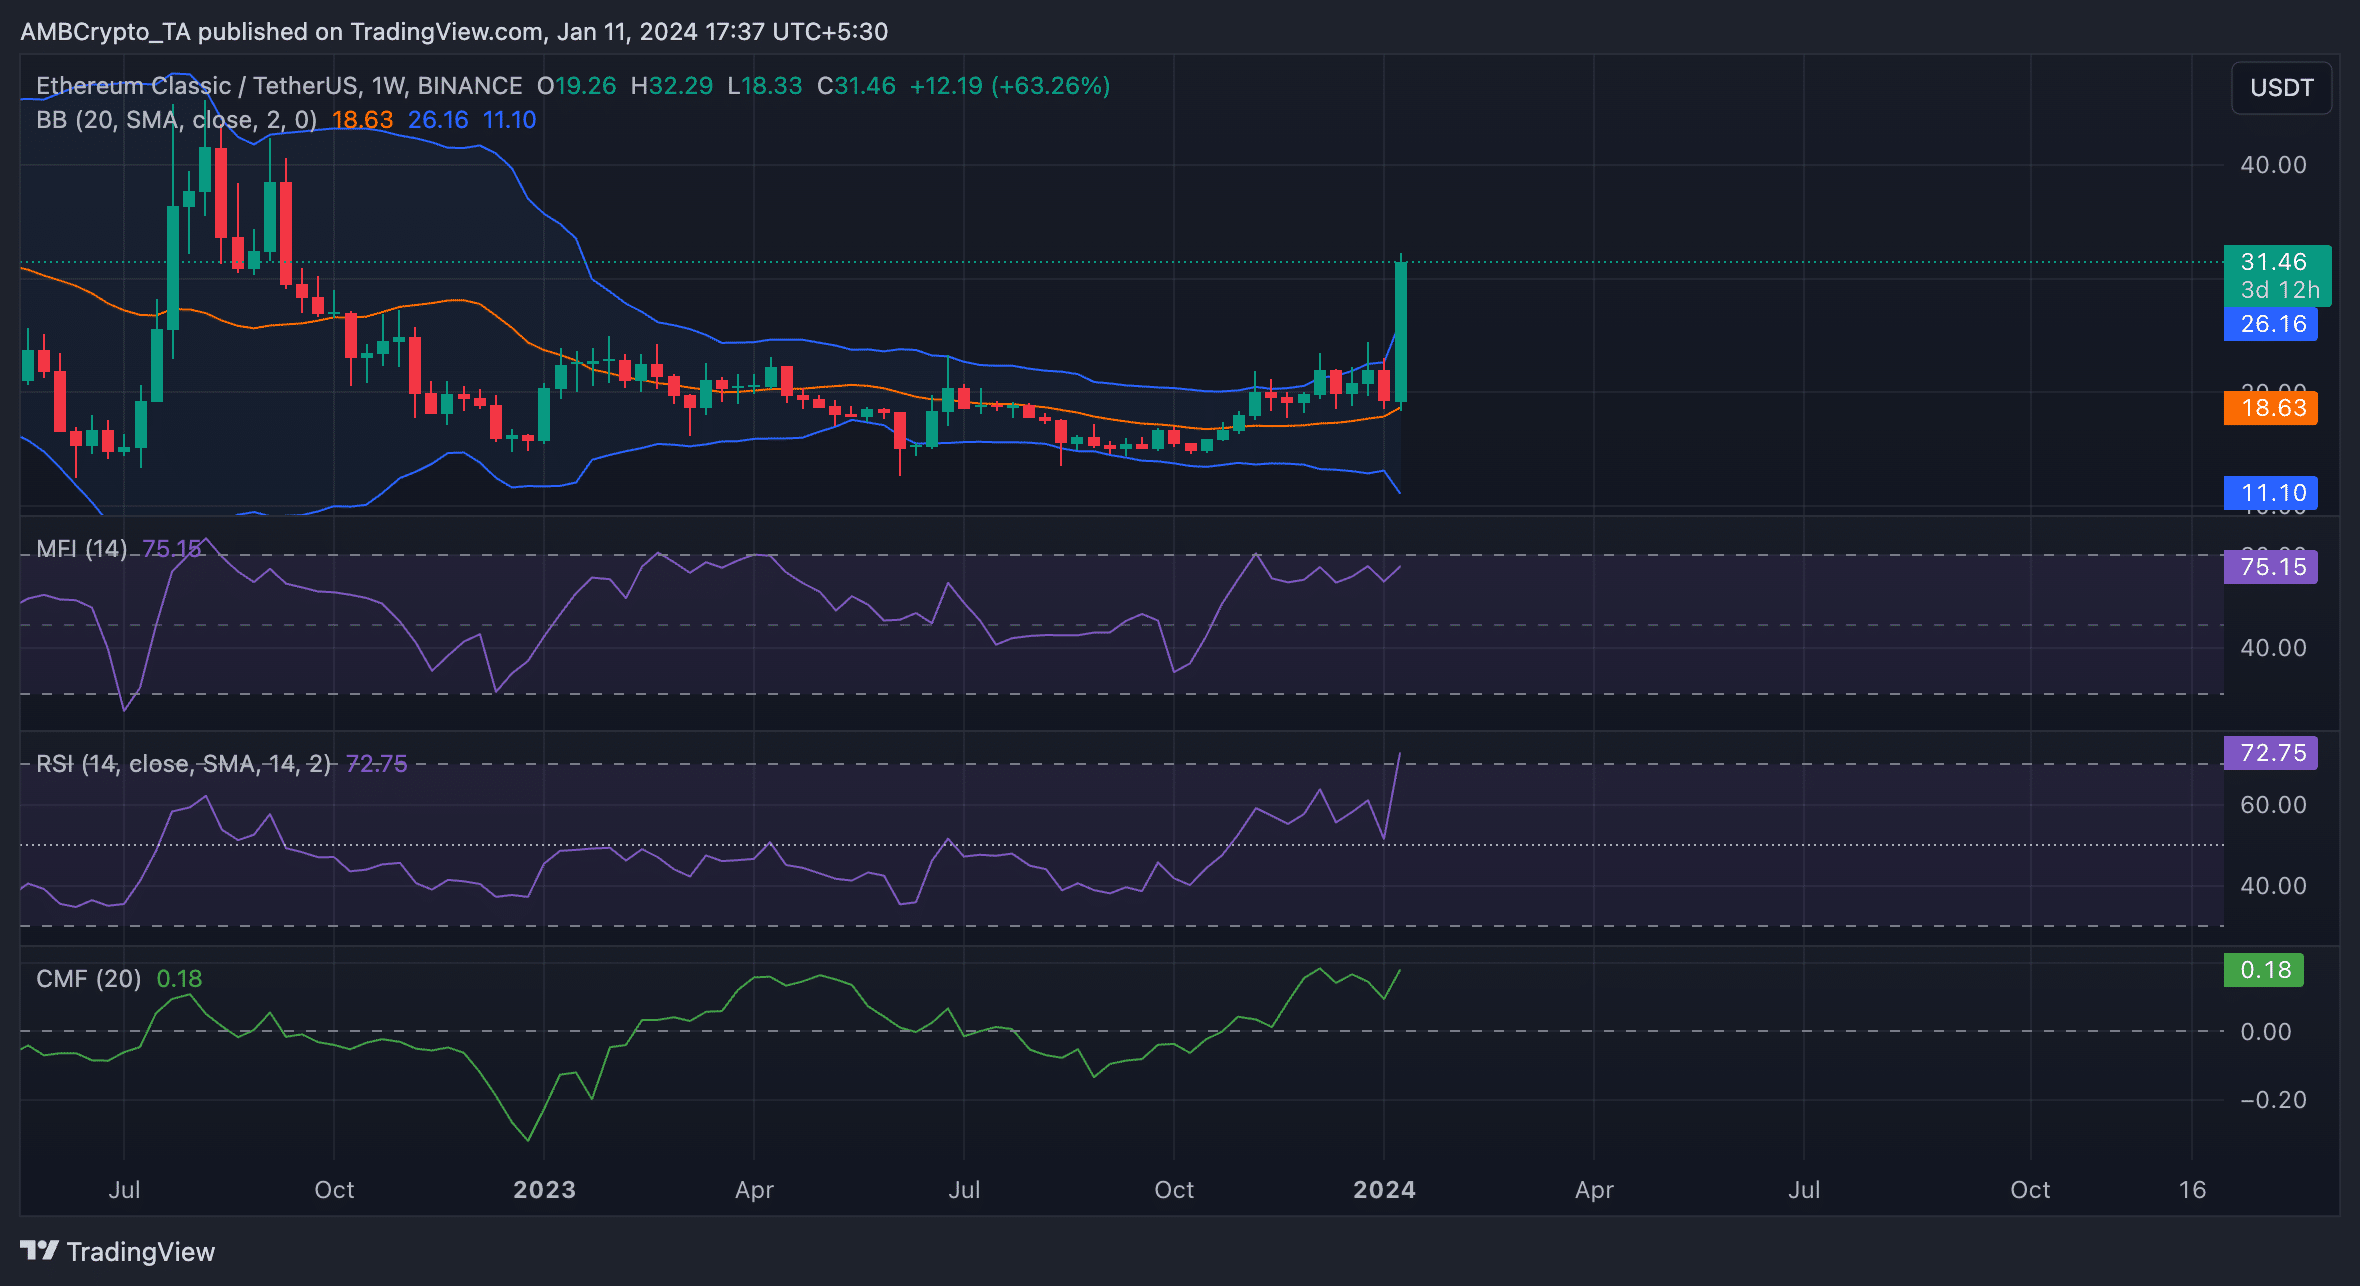
At press time, ETC traded at $31.42. The last time the coin traded at this high was in September 2022, per data from CoinMarketCap.
Its price movements assessed on a weekly chart showed a persistent accumulation pattern among traders. This had occurred despite the downtrend in ETC price since the year began prior to the recent rally.
Its key momentum indicators were spotted at overbought levels at press time. For example, the coin’s Relative Strength Index (RSI) was 72.75, while its Money Flow Index (MFI) was 75.15. At these values, these indicators suggested that buying momentum exceeded coin sell-offs.
Further, the coin’s Chaikin Money Flow (CMF) was spotted in an uptrend at 0.18, showing a steady inflow of liquidity into the ETC market.
However, the unexpected price rally resulted in increased price volatility. The coin’s price traded significantly above the upper band of the Bollinger Bands indicator at press time. When this happens, the market is deemed to be overheated, and a retracement usually follows.
ENS follows suit
Also witnessing a double-digit price rally in the past 24 hours, the ENS market was significantly volatile at press time. As its price rose, the gap between the upper and lower bands of its Bollinger Bands indicator widened.
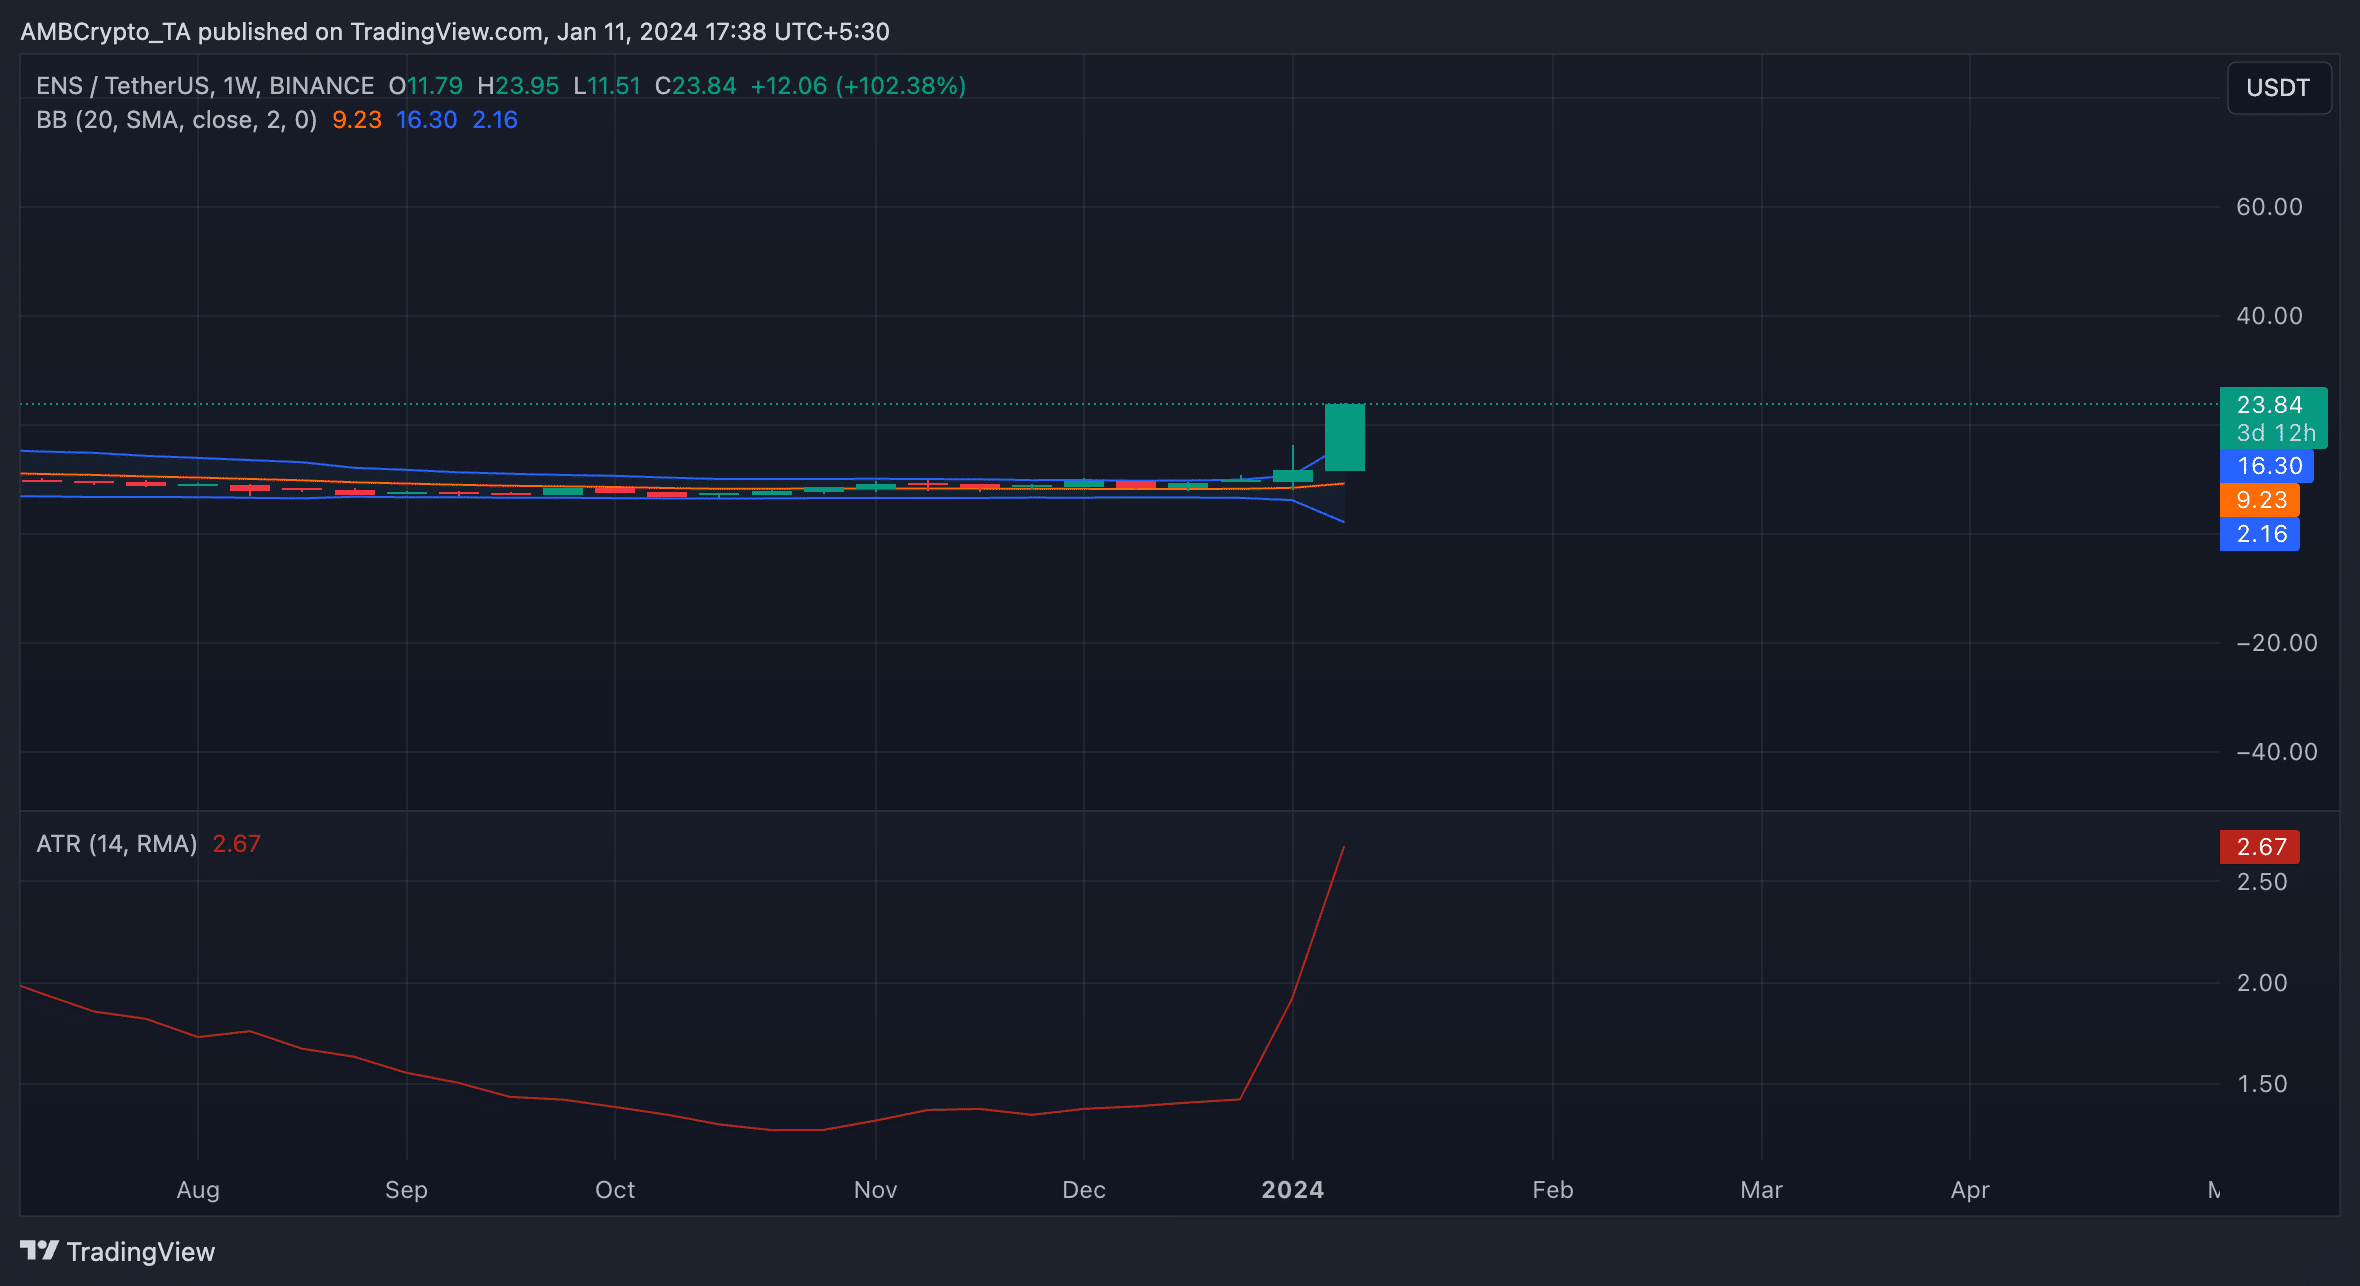
When the gap between the upper and lower bands of the Bollinger Bands increases, it’s generally considered a sign of increased volatility.
Confirming that ENS’ price was prone to swings, its Average True (ATR) range initiated an uptrend. At press time, this indicator returned a value of 2.67.
This indicator measures market volatility by calculating the average range between high and low prices over a specified number of periods. When it rises, there is volatility in the market.


