Ethereum, Litecoin, Chainlink Price Analysis: 15 June

Ethereum traded within a ascending triangle and presented targets at $3,100 or even $3,600 in an extreme bullish outcome. Litecoin could see a rally towards $240 over the coming sessions. Finally, bullish momentum could push LINK beyond $27-resistance.
Ethereum [ETH]
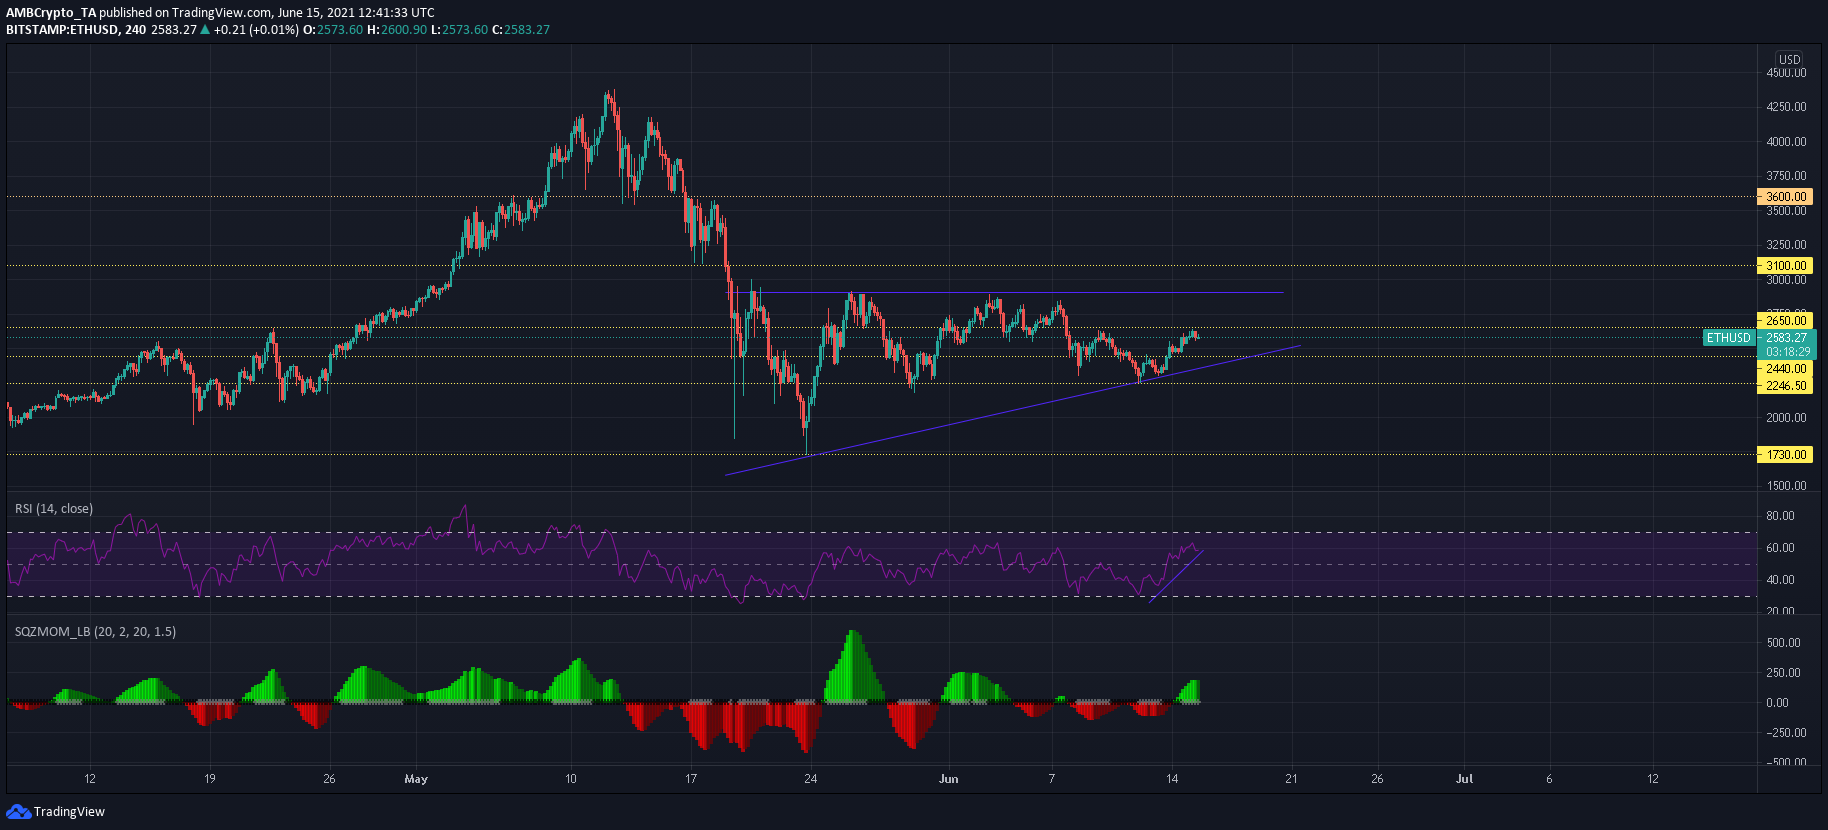
Ethereum formed an ascending triangle on its 4-hour chart and a breakout was expected over the coming days. The $2,900-resistance level formed the upper trendline of the pattern. However, there was some resistance around $2,650 as well that needed to be cleared before approaching $2,900. RSI traded in bullish territory and a favorable outcome can be expected as long as the index remains above 55-60. Bullish momentum was also on the up according to Squeeze Momentum Indicator.
A breakout from the pattern could be countered around $3,100, but successfully clearing this level could boost ETH all the way towards $3,600.
Litecoin [LTC]
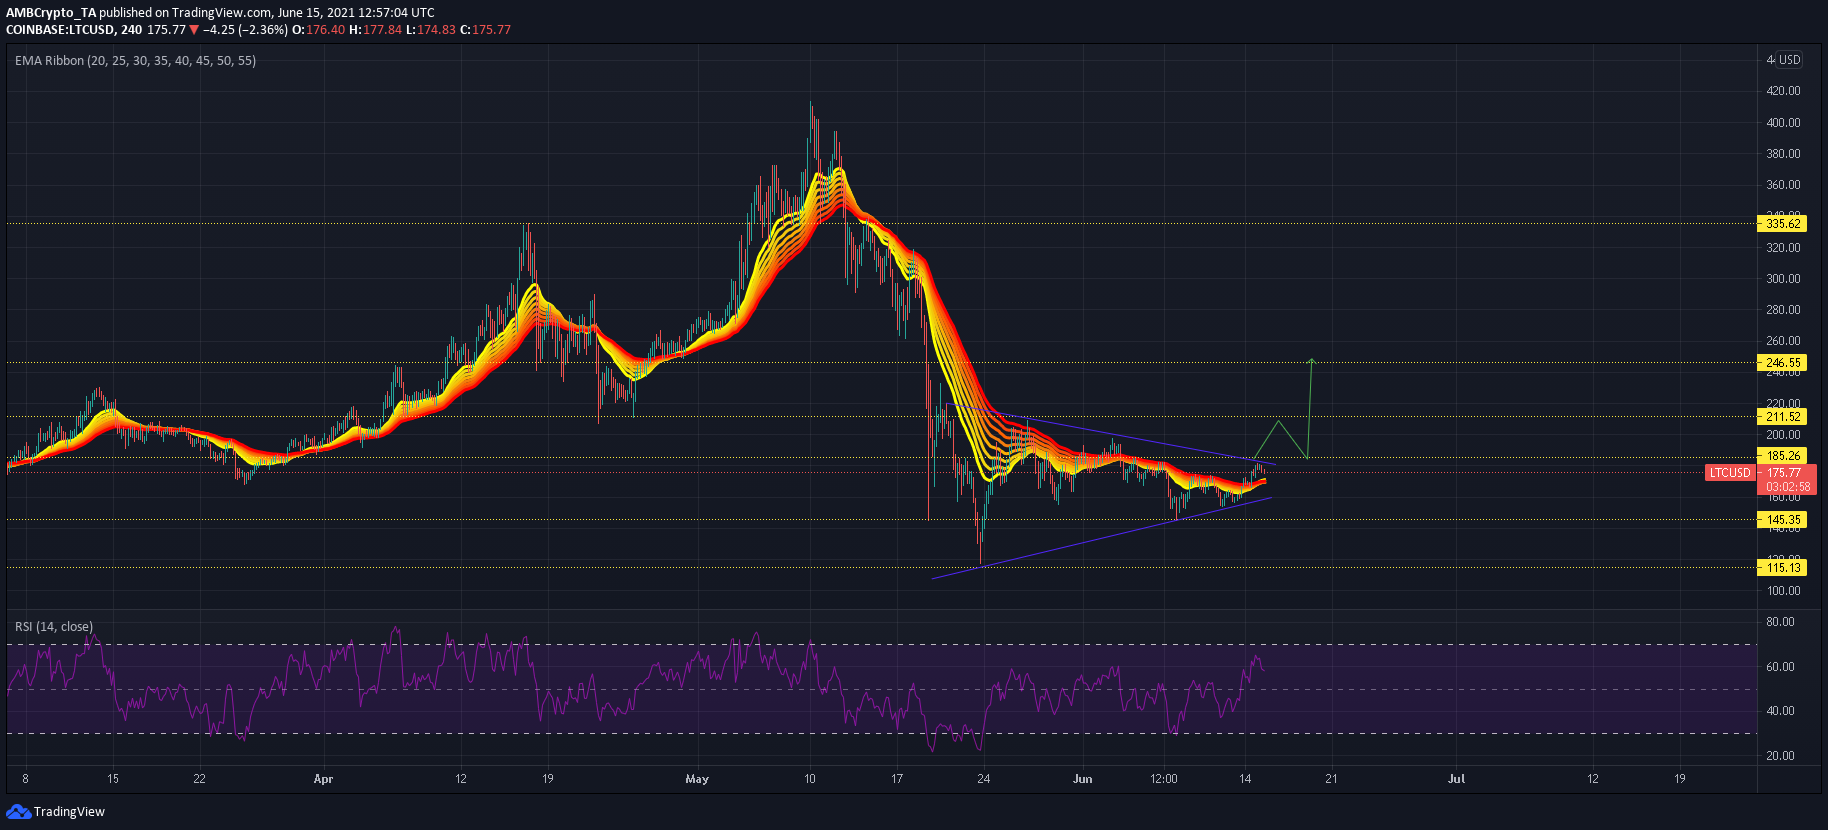
EMA Ribbons on Litecoin’s 4-hour chart crossed over and signaled a shift of trend in the market. Hence, the coming sessions would be of much significance and could see a breakout of LTC’s symmetrical triangle. Such an outcome could trigger a sharp rally towards LTC’s major resistance point of $240. Even though RSI pointed north at the time of writing, it remained in bullish territory above 55.
Consolidation within its current pattern but since the 24-hour trading volumes were on the up, a breakout was expected sooner rather than later.
Chainlink [LINK]
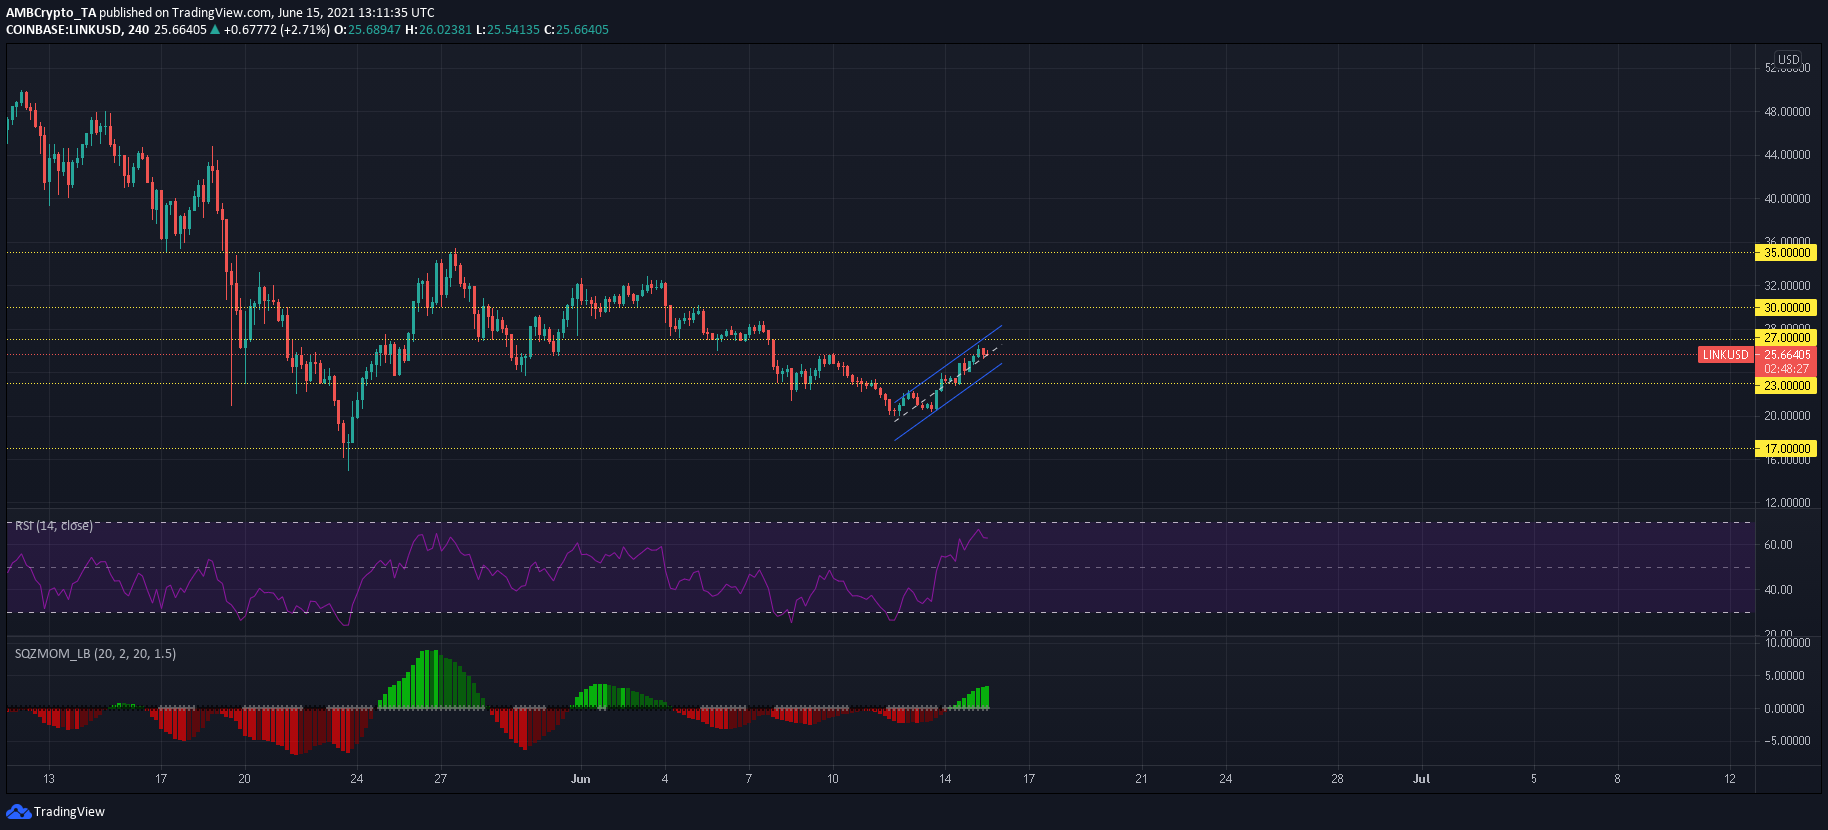
At the time of writing, Chainlink’s up-channel approached a crucial resistance mark around $27. Failing to rise above this region could result in a retracement back towards $23 and this would align with a breakdown from a bearish pattern. However, a successful breakout cannot be discounted especially considering bullish momentum in the market. Squeeze Momentum Indicator showed a series of rising green bars in a volatile market. If the trend were to continue, LINK could break above its upper ceiling and challenge its next resistance at $30.
RSI’s movement would add some more clarity moving forward. Keeping above 55-60 would enable a bullish outcome, whereas a dip below 40 could result in a breakdown from the pattern.


