Ethereum looks bearish as selling pressure is on the rise

Ethreum was trading at $172.24 at press time with a downfall of 1.54% on the 24-hour price chart and registered a market cap of $18.5 billion. The altcoin has been trying to recover from its losses which were triggered on 24th September, which saw the majority of the cryptocurrency market depreciate in value.
6-Hour Price Chart

Source: TradingView
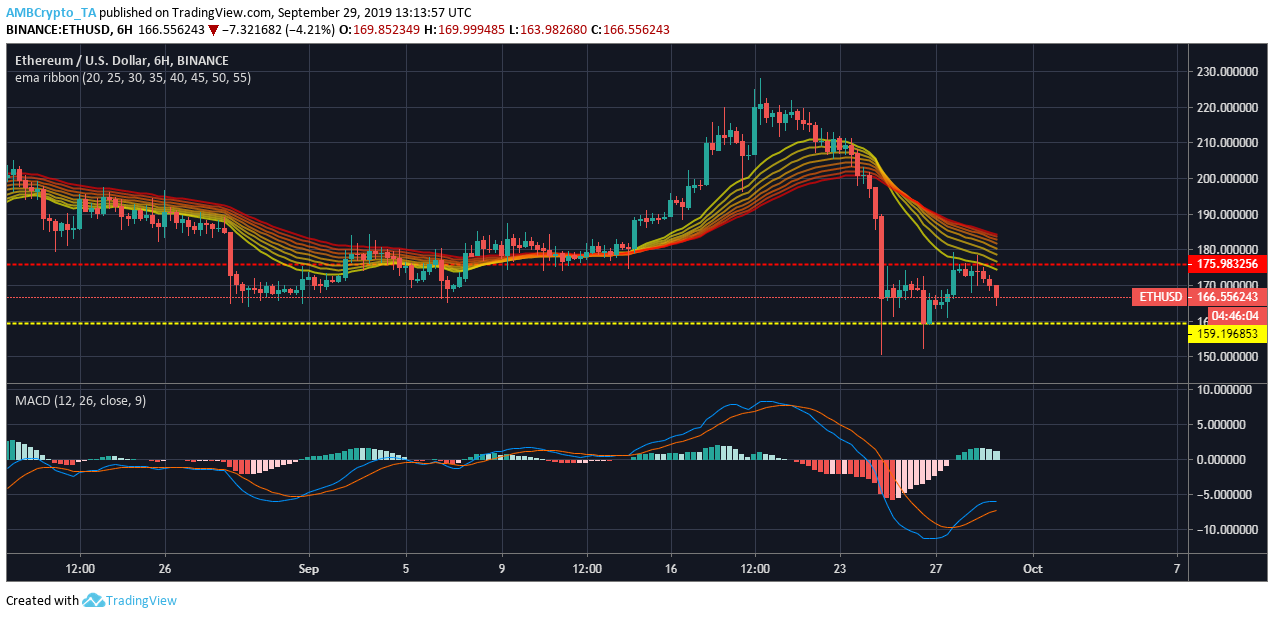
On the 6-hour price chart, immediate support registered at $159.19 while the altcoin needed to break past immediate resistance at $175.98 to make a bullish breakout. The ema ribbon converged above candles on 25th September, followed by a massive bearish breakout, and since then Ethereum has been on a recovery mode. If the ribbon falls below the candles in the near future, it might see a bullish breakout.
MACD indicator showed bullish sentiment, where MACD line had a bullish cross over with the signal line and it was moving above it since 27th September.
12-Hour Price Chart

Source: TradingView
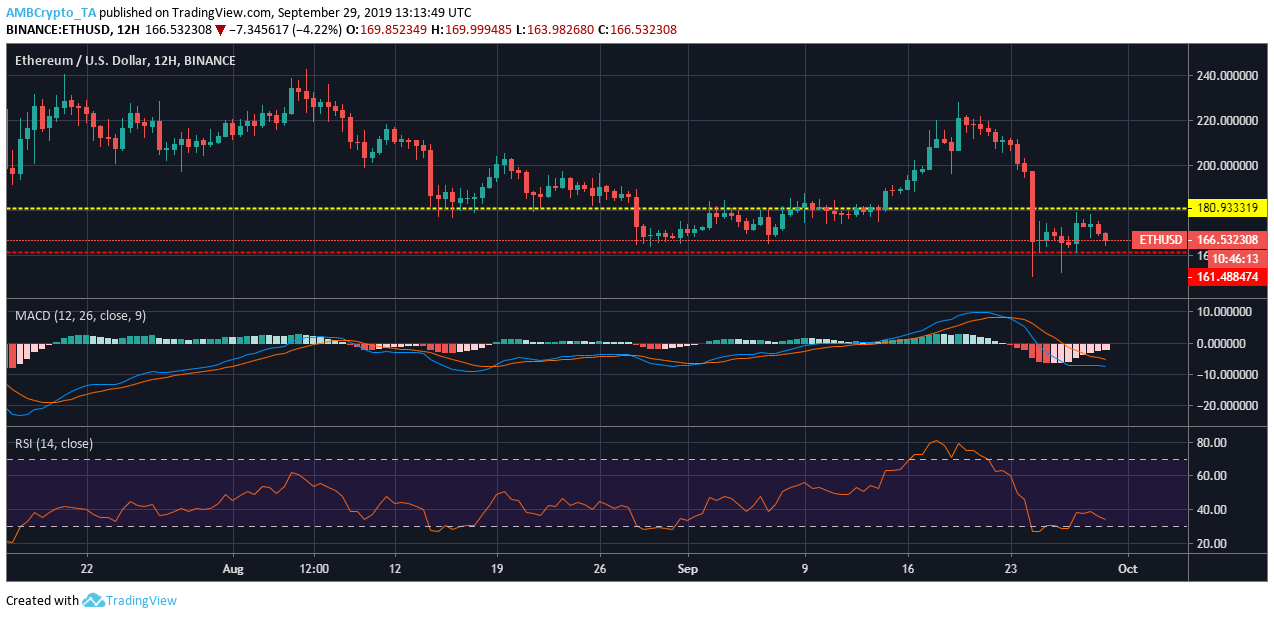
On the 12-hour price chart, Ethereum formed support at $161.48, while it needed to breach through resistance at $180.93 to make a bullish case. MACD indicator looked bearish as the MACD line went through a bearish cross-over on 27th September, since then it has been moving under the signal line.
RSI indicator showed high bearish sentiment as sellers had an upper hand since the massive price downfall on 24th September. The coin was oversold from 24th to 27th September, and since then selling pressure has been high on investors. Thus, RSI indicator looked bearish.
Conclusion
Ethereum looked bearish in the long term following bearish breakout on 24th September. MACD indicator looked to make a bullish cross-over on 27th September but, in the long run, bears have an upper hand. The 12-hour price chart looked bearish where both MACD and RSI showed that bears had an upper hand.

![Uniswap [UNI] price prediction - Traders, expect THIS after altcoin's 14% hike!](https://ambcrypto.com/wp-content/uploads/2024/12/UNI-1-400x240.webp)


