Ethereum, Monero, VeChain Price Analysis: 28 May

After testing the resistance level at $40k, the value of Bitcoin was once again pushed lower at press time. As the world’s largest crypto slipped, the market’s altcoins too noted strong sell-offs on the price charts. Ethereum, for instance, was on a steady downtrend, with the rest of the market’s alts mirroring ETH’s trend.
Ethereum [ETH]

Source: ETHUSD on TradingView
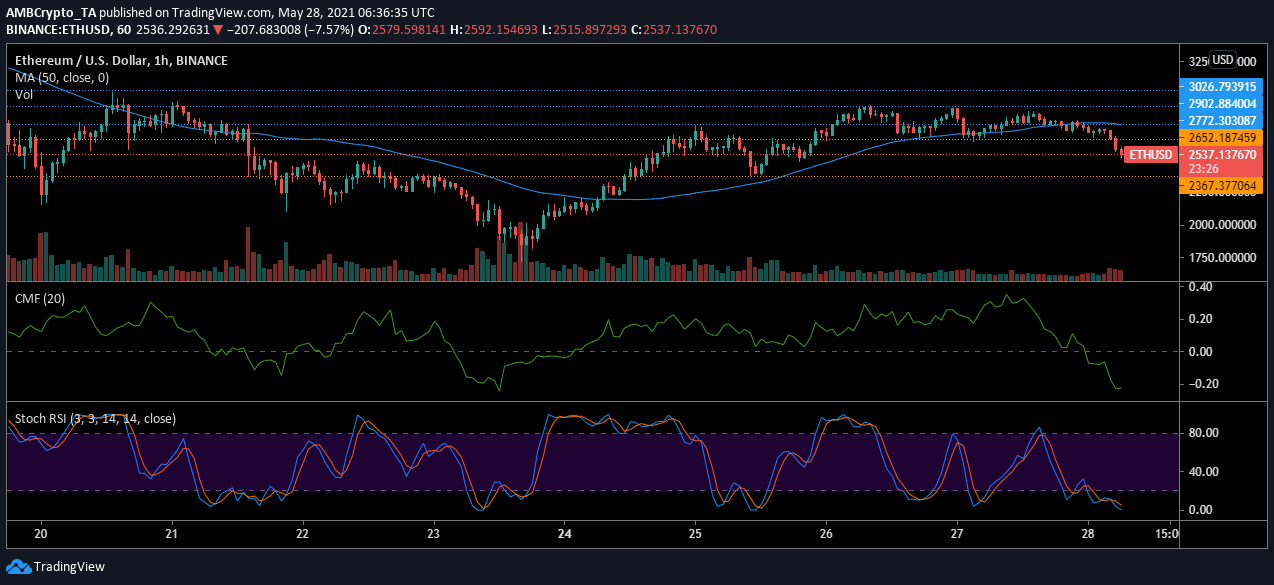
As Ethereum devs try to make the project more environment-friendly, its holders have been holding on to the cryptocurrency. After establishing support at $2,652.18, the price could not hold on to it and fell. At the time of writing, Ether was trading at $2,551.93. As it continued to trend lower, the next support lay at $2,367.37.
This change in price trend was brought about when the 50 Moving Average crossed over the candlesticks. As the price began to trend lower, traders realized profits and were selling their ETH. As the selling gained momentum, money that had entered the market left.
The Chaikin Money Flow affirmed this as the indicator dropped under zero, suggesting that the money was flowing out of the market. Meanwhile, Ether had already hit the oversold zone and might see some support from the market’s buyers.
Monero [XMR]

Source: XMRUSD on TradingView
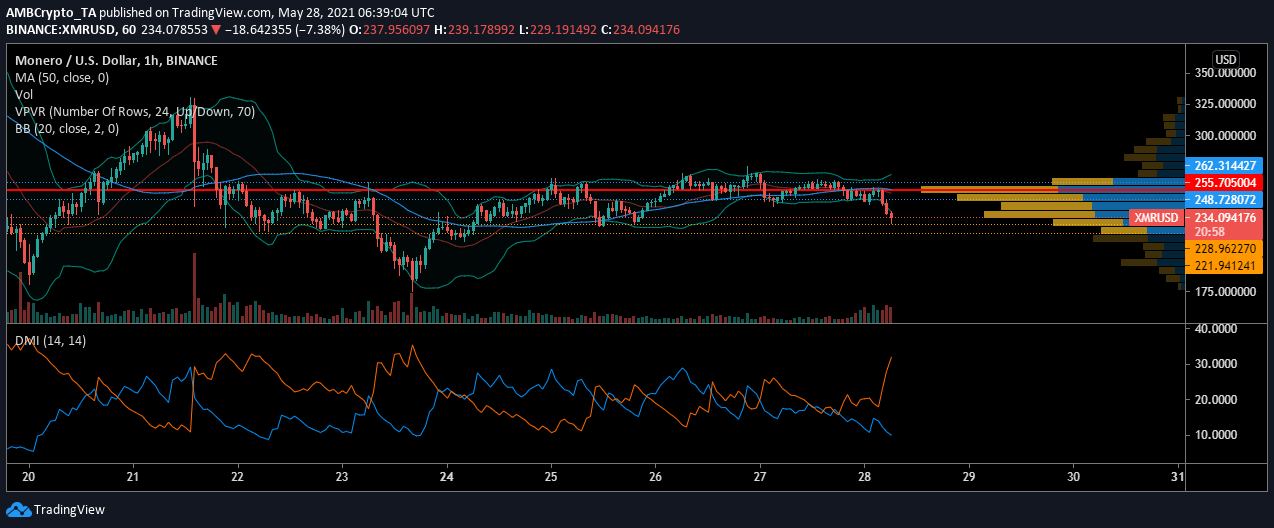
Monero’s traders were initially supporting its value above $248 and as indicated by the Visible Range indicator, the highest trading took place at $255. As the price slipped from this treading range, it fell to the support at $228. As XMR was being traded at $233 at press time, the volatility grew exponentially and the market could expect more price swings soon.
Meanwhile, the volume was seen supporting the falling price as more traders realized their positions on the way down. For a contrarian, this could be a sign of buying the dip and may give way to the price recovering to $248. The Directional Movement Index [DMI] found that the -DI was above the +DI, suggesting there was more downward pressure on the price. However, while writing, the -DI was pointing south, which could be a sign of a trend reversal taking shape.
VeChain [VET]

Source: VETUSD on TradingView
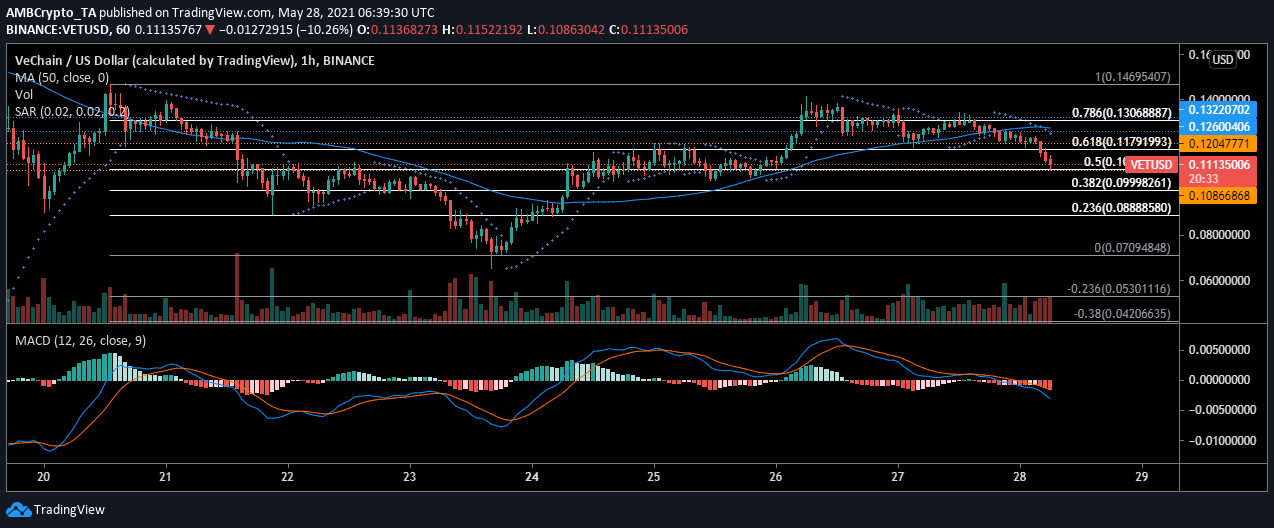
VeChain’s [VET] market has followed the steps of the ETH market and was noting a strong plunge in value, at the time of writing. The crypto-asset has been on a downtrend since yesterday and the latest price push caused VET to break support at $0.1204 and trade at $0.1121, at press time.
However, given the downtrend, the market was already shaping up for bearish implications. The Parabolic SAR’s markers had aligned above the candlesticks, suggesting that the asset was not being bought at the current price and was being pushed mainly lower. Although VET noted a brief period of recovery, the overall sentiment in the market remained bearish. The MACD line confirmed this as it crossed under the Signal line on 26th May. The alt’s price has been slipping ever since.


