Ethereum Price Analysis: 07 June

Ethereum’s price has been inching towards higher ground after it turned bouncing off of support at $2,584. The price surged by 9.36% within a day and ETH was trading at $2,784.
As Ethereum moved along this price range, there could be a small period of consolidation which may turn into a bearish trend in the short-term market.
Ethereum hourly chart

Source: ETHUSD on TradingView
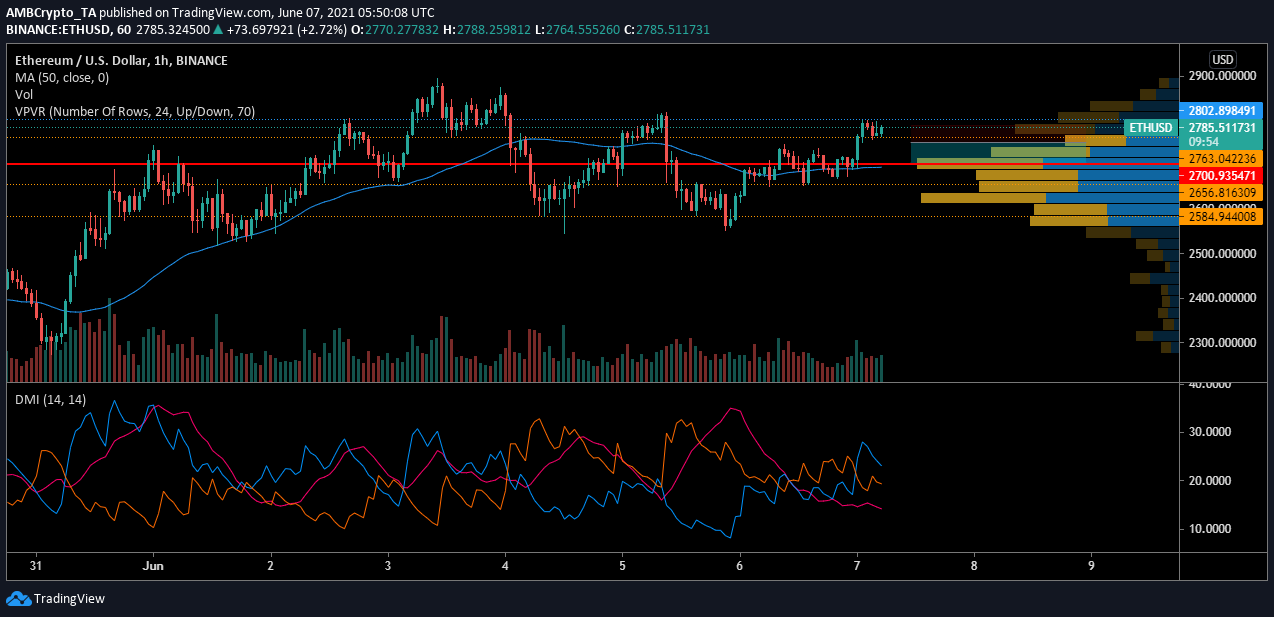
The above chart showed that $2,584-level has been tested twice and resulted in a similar form of break out. As the price traded close to resistance at $2,792, it may continue to hold this level until selling pressure builds up.
This could result in ETH’s value losing support and tumbling down to $2,700.
Reasoning
The Ethereum market took a bullish turn with the price rallying over the past day. The 50 moving average was under the price sticks which was a sign of an upward trending market. However, as ETH was repeating a previous trend, chances of a price fall also become imminent.
Visible Range indicator was suggesting that the current price level was not seeing active trading. If the price breaches support, it might be heading lower to the $2,700 price, where trading activity was higher. The indicator also suggested that this level was a point of control in the current period.
Interestingly, Directional Movement Index was also noting that +DI was close to crossing under -DI, which could boost the bearishness in the market. If that were to happen, that would be mean the rise of downward pressure in ETH market, which could lead to its sell-off.
Crucial levels
Entry-level: $2,750.67
Take Profit: $2,705.66
Stop-level: $2,788.94
Risk and Reward: 1.18
Conclusion
The current Ethereum market was bullish, but there have been signs of a trend reversal emerging. With the asset trading close to support $2,763, a step under this level could trigger sell-off and the price may find the next trading range at $2,700.


