Ethereum Price Analysis: 14 December

Disclaimer: The findings of the following analysis are the sole opinion of the writer and should not be taken as investment advice
Ethereum‘s price has been stagnating over the past few weeks, despite Bitcoin-inflicted drops. In fact, ETH’s price was stuck at $586 as it tried to reclaim its price before the said drops. When the crypto’s long-term scenario was considered, it was found that ETH formed an ascending channel, one which was bearish. However, the chances of this pattern being invalidated seemed to be high at press time, especially if Bitcoin moves parabolically.
The following article will take a look at the short-to-mid term scenario for ETH’s price, while also looking into what to expect.
Ethereum 1-day chart
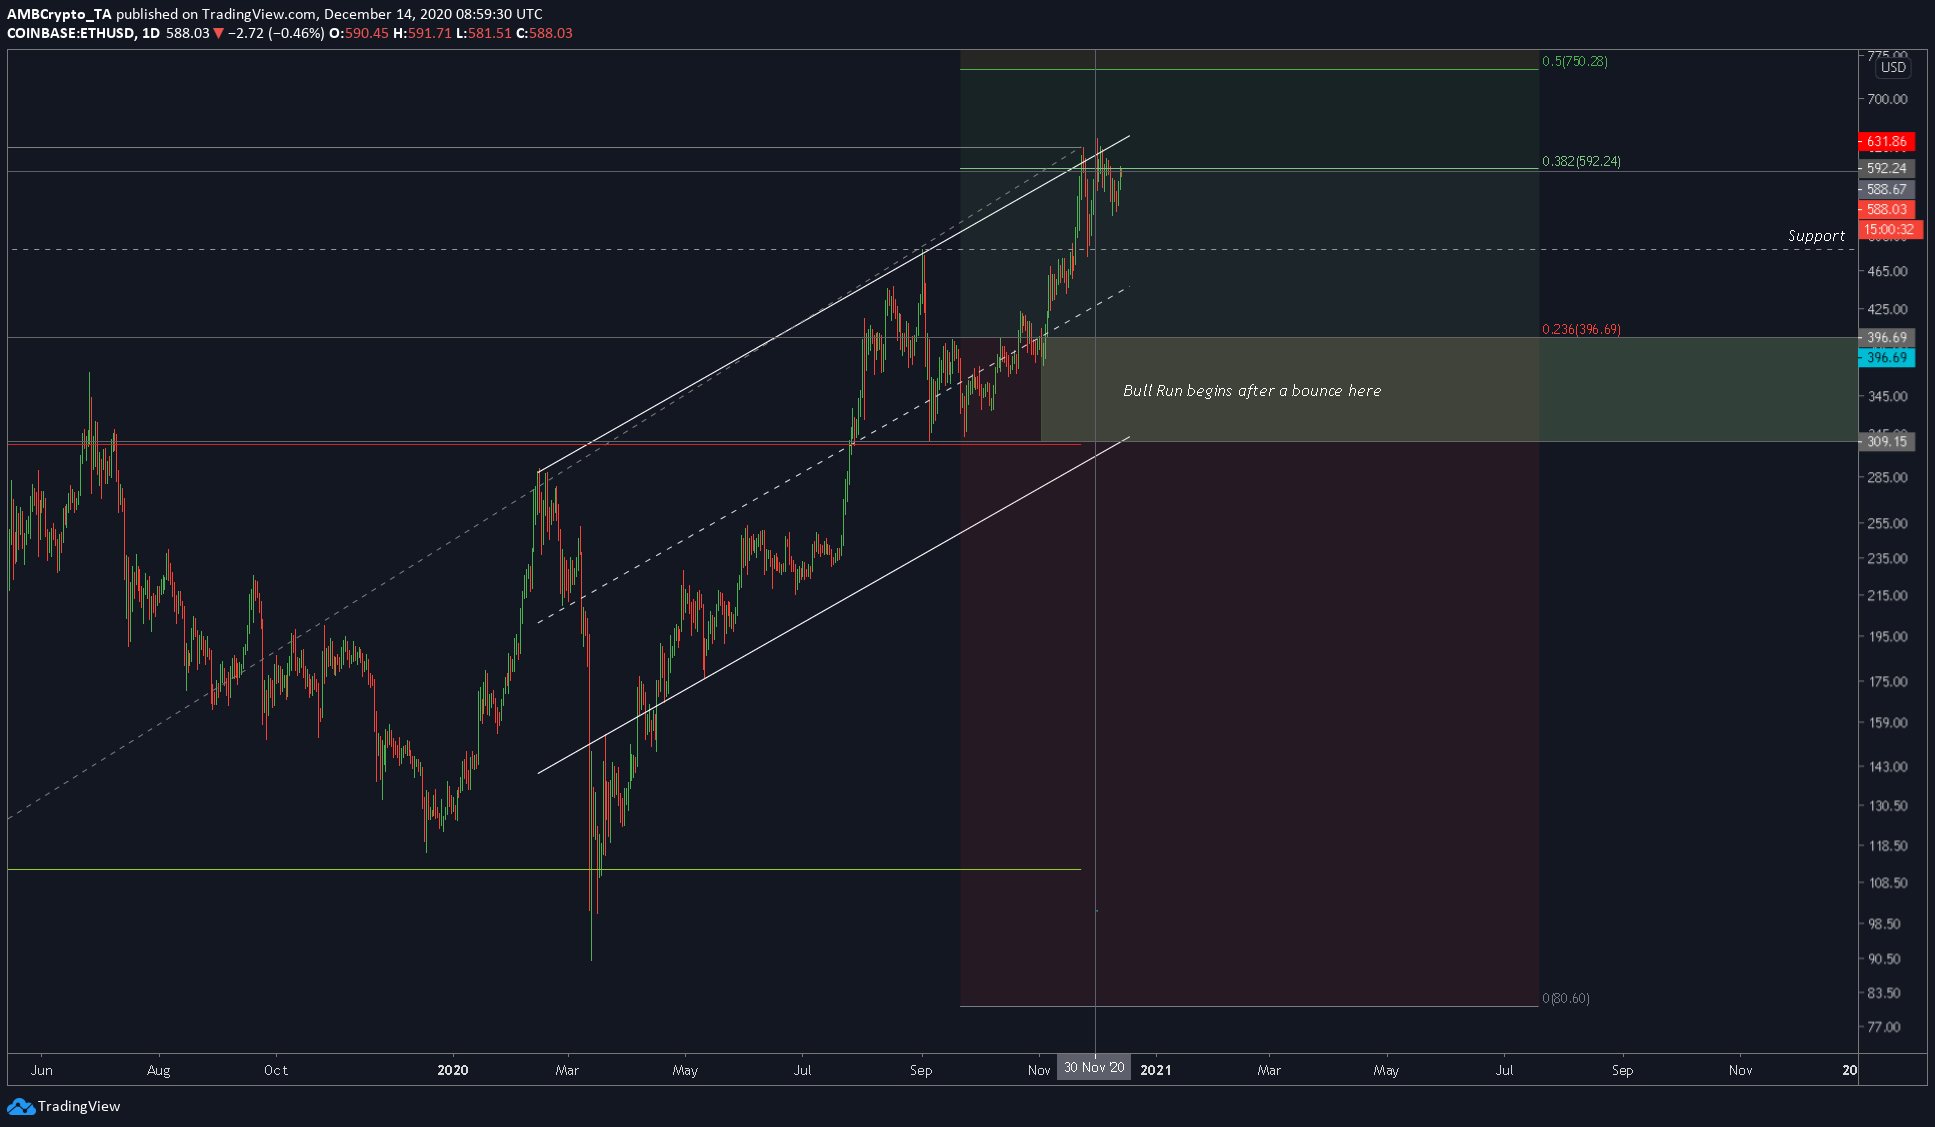
The 1-day chart for ETH highlighted the aforementioned bearish pattern and important levels on the daily timeframe. There were two key levels – a range extending from $309 to $396 and $488.95.
A bounce from either of these could help with the breakout from the channel and propel ETH into the stratosphere. However, the price, at press time, seemed to be surging due to a bounce on the second level back on 26 November 2020.
So, what will ETH do? ETH will move sideways before it decides whether it should surge or drop.
Rationale
Hence, we can expect the bulls to test this level until it breaks or fail from exhaustion and drops lower to the support at $488. Hence, due to these mixed signals, we can expect ETH to go sideways as it tests this level. This will be based on the presumption that Bitcoin doesn’t have any volatility-induced movements.
Moreover, the RSI formed a bearish divergence on the daily timeframe.
Conclusion
Overall, ETH did show a bearish bias. However, this bias will be fed should the price fail to capture the $592-level. Expecting a drop if this doesn’t come to play should be obvious, in which case, the support level at $488 will be tested first, followed by the aforementioned range.