Ethereum Price Analysis: 15 April


Disclaimer: The findings of the following analysis are the sole opinions of the writer and should not be taken as investment advice
The Berlin upgrade for the Ethereum network went off without a hitch at block 12,244,000. Optimism around this news fueled an ETH move to an ATH of $2,487 a few hours ago. What’s more, Ethereum supply on exchanges has also continued to drop, despite the price being pushed higher on the charts, showing that holders are willing to hold and accumulate further in expectation of higher prices.
Ethereum 1-hour chart
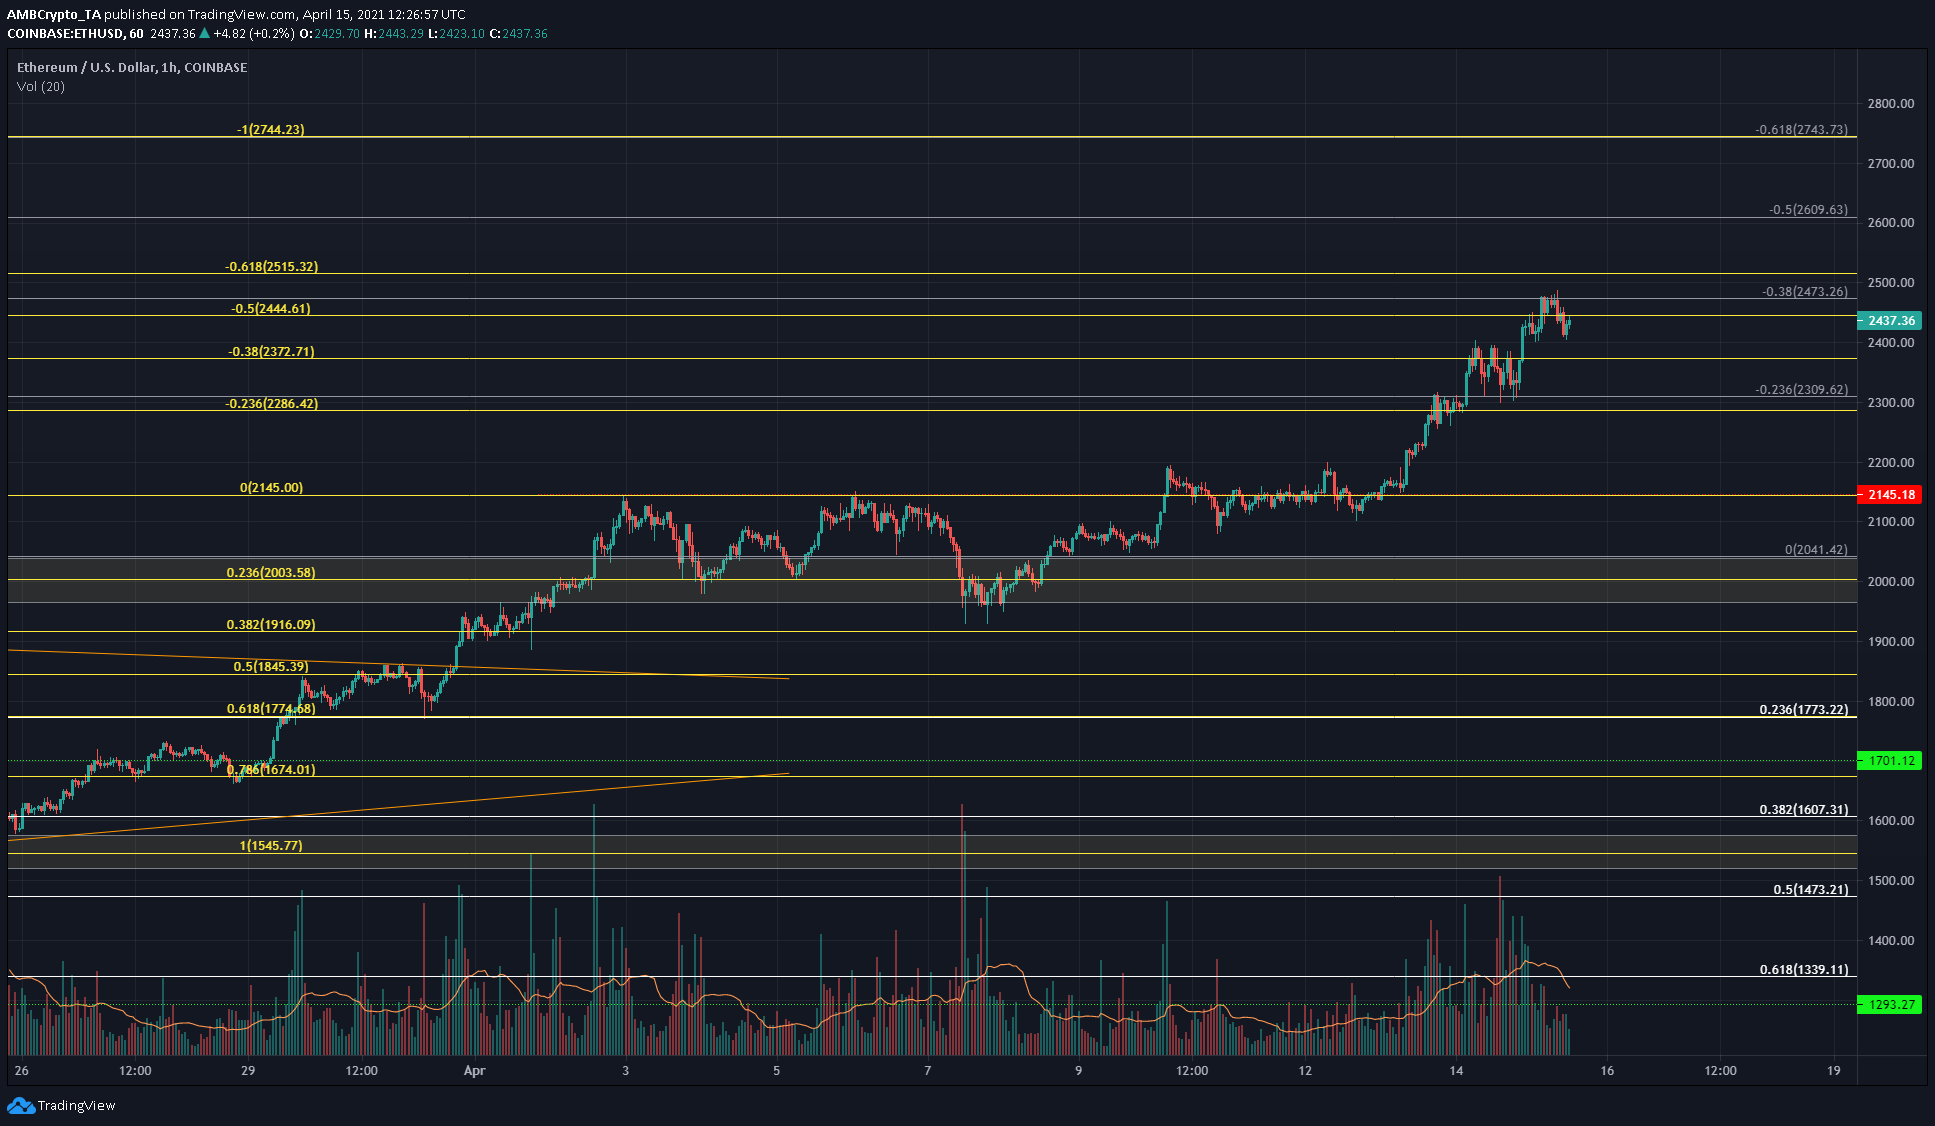
On the charts, ETH faced some resistance at one of the extension levels plotted based on a former move. In yellow are the Fibonacci retracement and extension levels, based on its move from $1545 to $2145 over the past three weeks.
In white and gray are retracement and extension levels (respectively) for ETH based on another move – this one from $901 to $2041, one that ETH has been on since 11 January.
There was some confluence between the two sets of Fibonacci levels plotted, and the price has respected these extension levels by finding resistance and support there, lending credence to the levels plotted further north.
At the time of writing, the short-term outlook was strongly bullish. A dip to $2,370-$2,380 can be seen, but this will only be a temporary halt before further advances.
Market Rationale
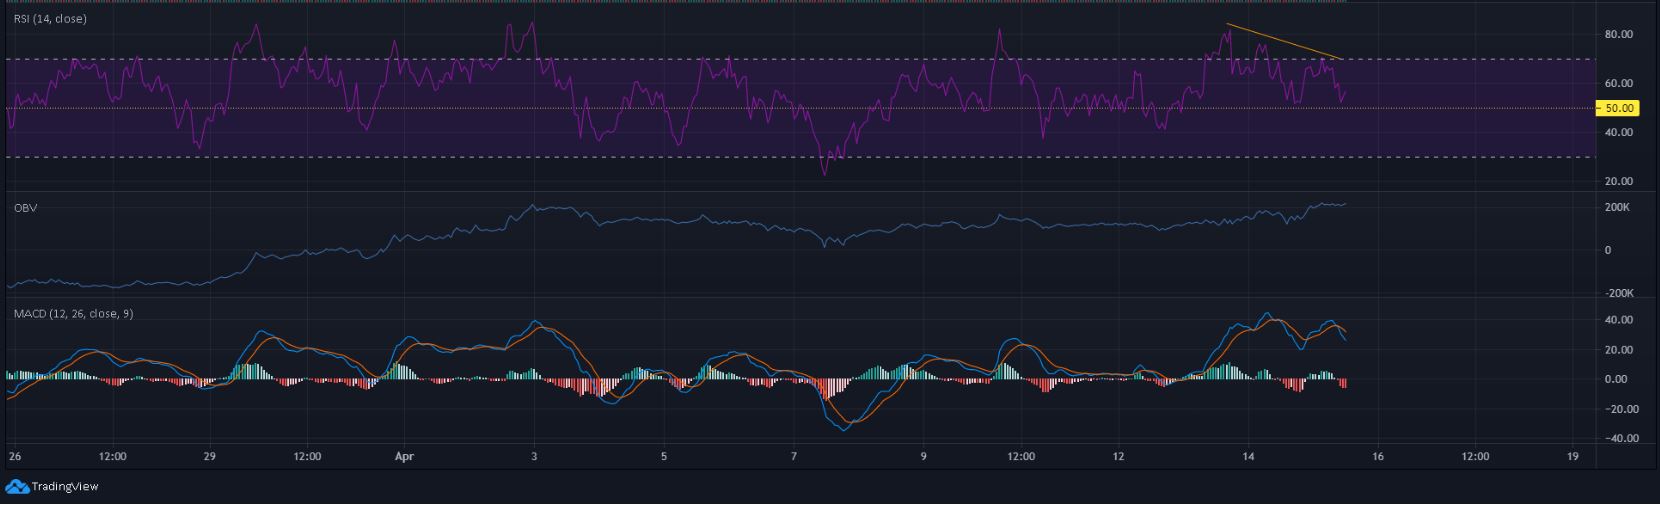
In orange is a bearish divergence seen on the RSI, while the price made higher highs over the same period. This is likely to see ETH correct to lower levels, with the $2,370 and $2,300 zones likely to be support levels.
The OBV did see some sharp dips over the past two weeks, but the sustained buying volume has outweighed these short bursts of selling, something evidenced by the steady uptrend of the OBV.
The MACD was also well above the zero line, although it dove to signal some short-term selling pressure due to the ETH pullback from $2,480 a few hours ago.
Conclusion
Based on the Fibonacci levels plotted here, it is expected that the next pitstop for ETH will be at $2,743 owing to the confluence between the 100% extension (yellow) and the 61.8% extension (white). There was also strong evidence of steady demand behind ETH, and this could drive the rally further north.