Ethereum price prediction: Buy or sell this summer?
Ethereum’s price has faced significant resistance at the $3200 price level in the past few weeks. What are the prospects of a price rally in the near future?



- The decline in Ethereum’s network activity has turned Ether inflationary.
- Despite recent price troubles, ETH’s long-term outlook remains significantly bullish.
Ethereum’s [ETH] supply has become inflationary, as the general market decline in the last month has decreased user activity on the network.
According to data from Ultrasound.money, the leading altcoin’s supply has risen by over 4,836 ETH in the past 30 days. In the last week alone, this has grown by 9,000 ETH.
ETH’s supply is deemed to have become inflationary when there is an uptick in the number of coins created and added to the circulating supply, thereby increasing the downward pressure on the coin’s price.
This happens when the Ethereum network witnesses a drop in user activity. On-chain data from Artemis revealed a decline in the daily count of unique addresses interacting with the Ethereum blockchain in the past 30 days.
Between 23rd March and 22nd April, Ethereum’s daily active address count fell by 22%. This led to a corresponding fall in the network’s daily transaction count. During the period under review, this dropped by 15%.
During the 30-day period in question, the network’s transaction fees peaked at $1.3 million on 12th April and initiated a decline. Between the 12th and 21st of April, Ethereum’s daily fees dropped by 8%.
When the Layer 1 (L1) network witnesses a decline in fees, it experiences a low burn rate. A reduced burn rate increases the amount of ETH in circulation, making the coin inflationary.
A look into the future
At press time, ETH exchanged hands at $3,173. Impacted by the general market decline in the last month, the coin’s value dropped by 5% during that period, according to CoinMarketCap’s data.
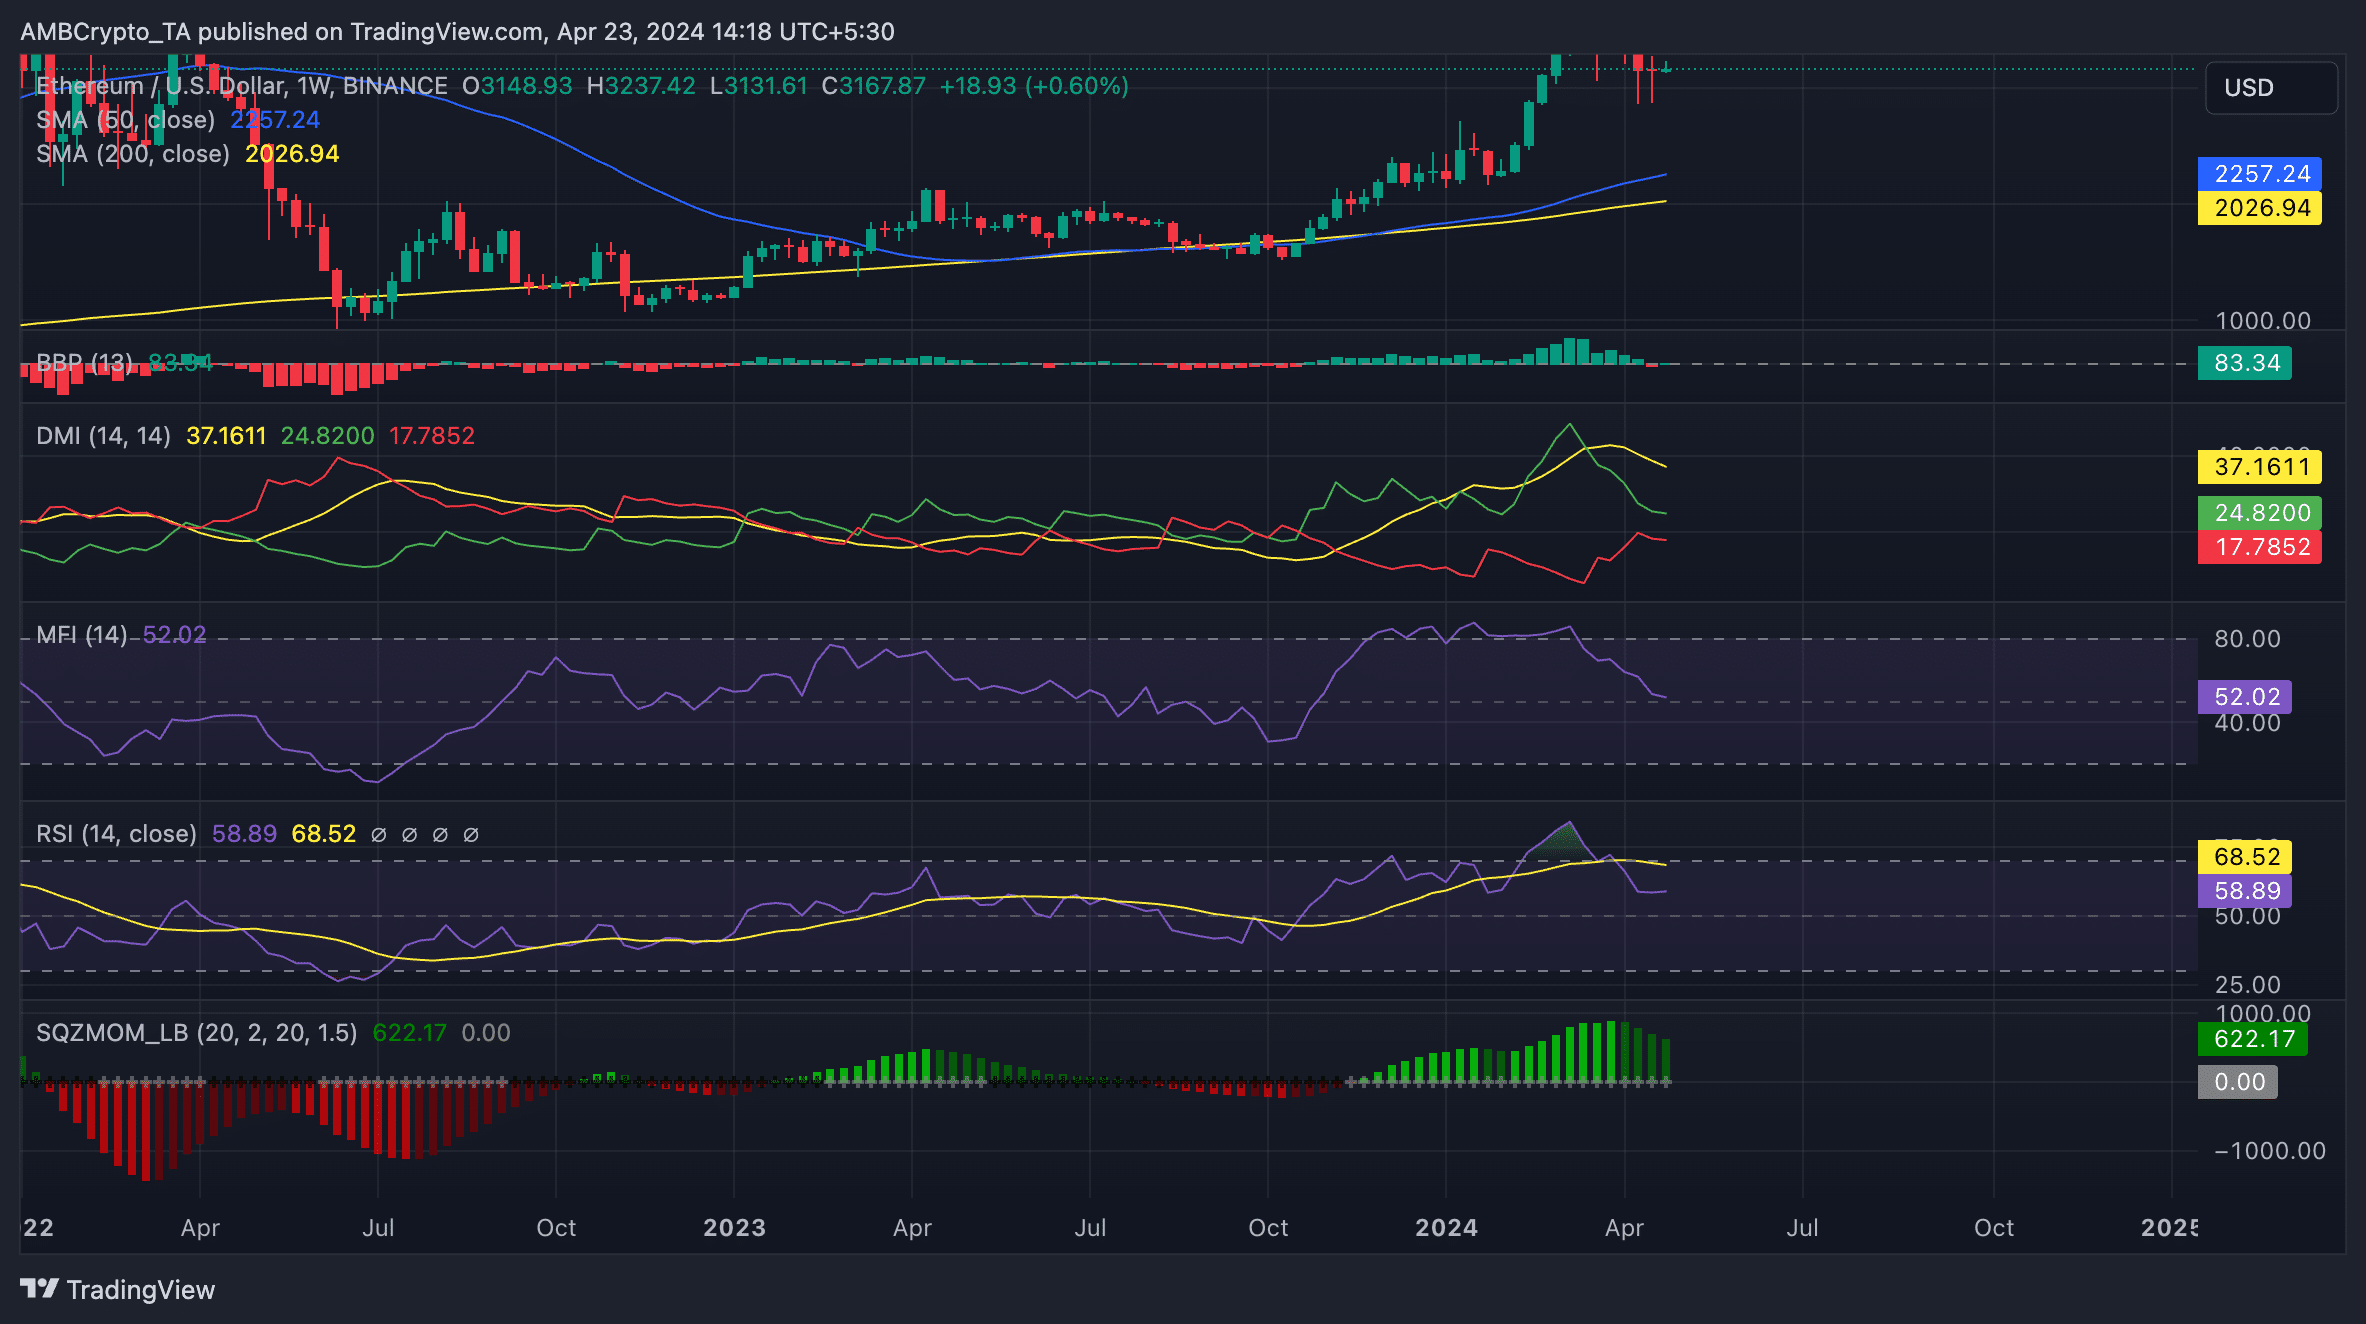
However, despite the recent market headwinds, ETH’s 50-day moving average (MA), which initiated a golden cross when the bull market rally began in October 2023, still lies above its 200-day MA on a weekly chart.
This implies that the coin’s shorter-term moving average has remained above the longer-term moving average for some time. This is generally viewed as a bullish signal, as it indicates that ETH has experienced a sustained price increase since October 2023, despite a few drawbacks.
Market participants may interpret this as a sign of continued strength in the asset’s price.
Readings from the coin’s Directional Movement Index confirmed this bullish outlook. The coin’s positive directional index (green), which also crossed above its negative directional index (red) in October 2023, has since maintained this position.
This crossover is regarded as a bullish signal as it signals a rise in the bullish momentum. If it occurs over an extended period, like in ETH’s case, traders view it as a confirmation of an uptrend in an asset’s price and a signal of a further price rally.
Another indicator worthy of note here is ETH’s Squeeze Momentum Indicator. It measures an asset’s momentum and tracks the consolidation phase of the market for traders looking to trade in a sideways market.
Price chart readings showed that ETH’s Squeeze Momentum Indicator has posted green upward-facing bars since November 2023.
When this indicator shows upward-facing green bars, the asset in question is experiencing upward momentum.
Despite the multiple declines in ETH’s price in the past several weeks, its Squeeze Momentum Indicator continues to display green upward-facing bars, indicating that the rally will continue in the long term.
Although the coin’s outlook remains bullish in the long term, the surge in ETH profit-taking activity since mid-February has led to a decline in some of its key momentum metrics.
As of this writing, ETH’s Relative Strength Index (RSI) and Money Flow Index (MFI) were 58.77 and 52.01, respectively.
While these values rest above 50, they suggest that recent market bearish trends have led to a slight decline in buying pressure.
However, a combined reading of ETH’s RSI, MFI, and the indicators assessed above showed that the coin is not in extreme overbought or oversold conditions. It also signals that the current trend may continue to be stable with a slight bullish bias.
ETH futures market
In ETH’s derivatives market, its futures open interest reached a year-to-date peak of $15 billion on 9th April and has since declined by 33%, per Coinglass data. As of this writing, the coin’s futures open interest was $10 billion.
This decline signaled a fall in trading activity in ETH’s futures market. When an asset’s open interest declines in this manner, it means that market participants are closing out their positions without opening new ones.
Is your portfolio green? Check the Ethereum Profit Calculator
Since the open interest decline began, the coin has closed five days with a negative funding rate, with the latest being on 22nd April. On those days, futures traders placed bets in favor of a decline in the coin’s value.
At press time, ETH’s funding rate across exchanges was 0.0023%, showing that long traders have regained control.