Ethereum price retraces: What does its prediction say?
Ethereum could face increased selling pressure, as shown by these metrics.

Disclaimer: The information presented does not constitute financial, investment, trading, or other types of advice and is solely the writer’s opinion.
- Ethereum saw a pullback from just above the long-term resistance at $2300.
- The dip in active addresses pointed to a reduction in demand for ETH in the market.
Ethereum [ETH] noted a decent retracement of its gains earlier in December. While the trend and the market structure remained bullish on the one-day chart, some on-chain metrics outlined that selling pressure was on the rise.
The deflationary nature of Ethereum should inspire confidence in long-term holders. Estimates of shrinking ETH supply do not help in the short-term market sentiment, and a move to $2000 or lower was still a possibility.
Will the $2130 support hold?
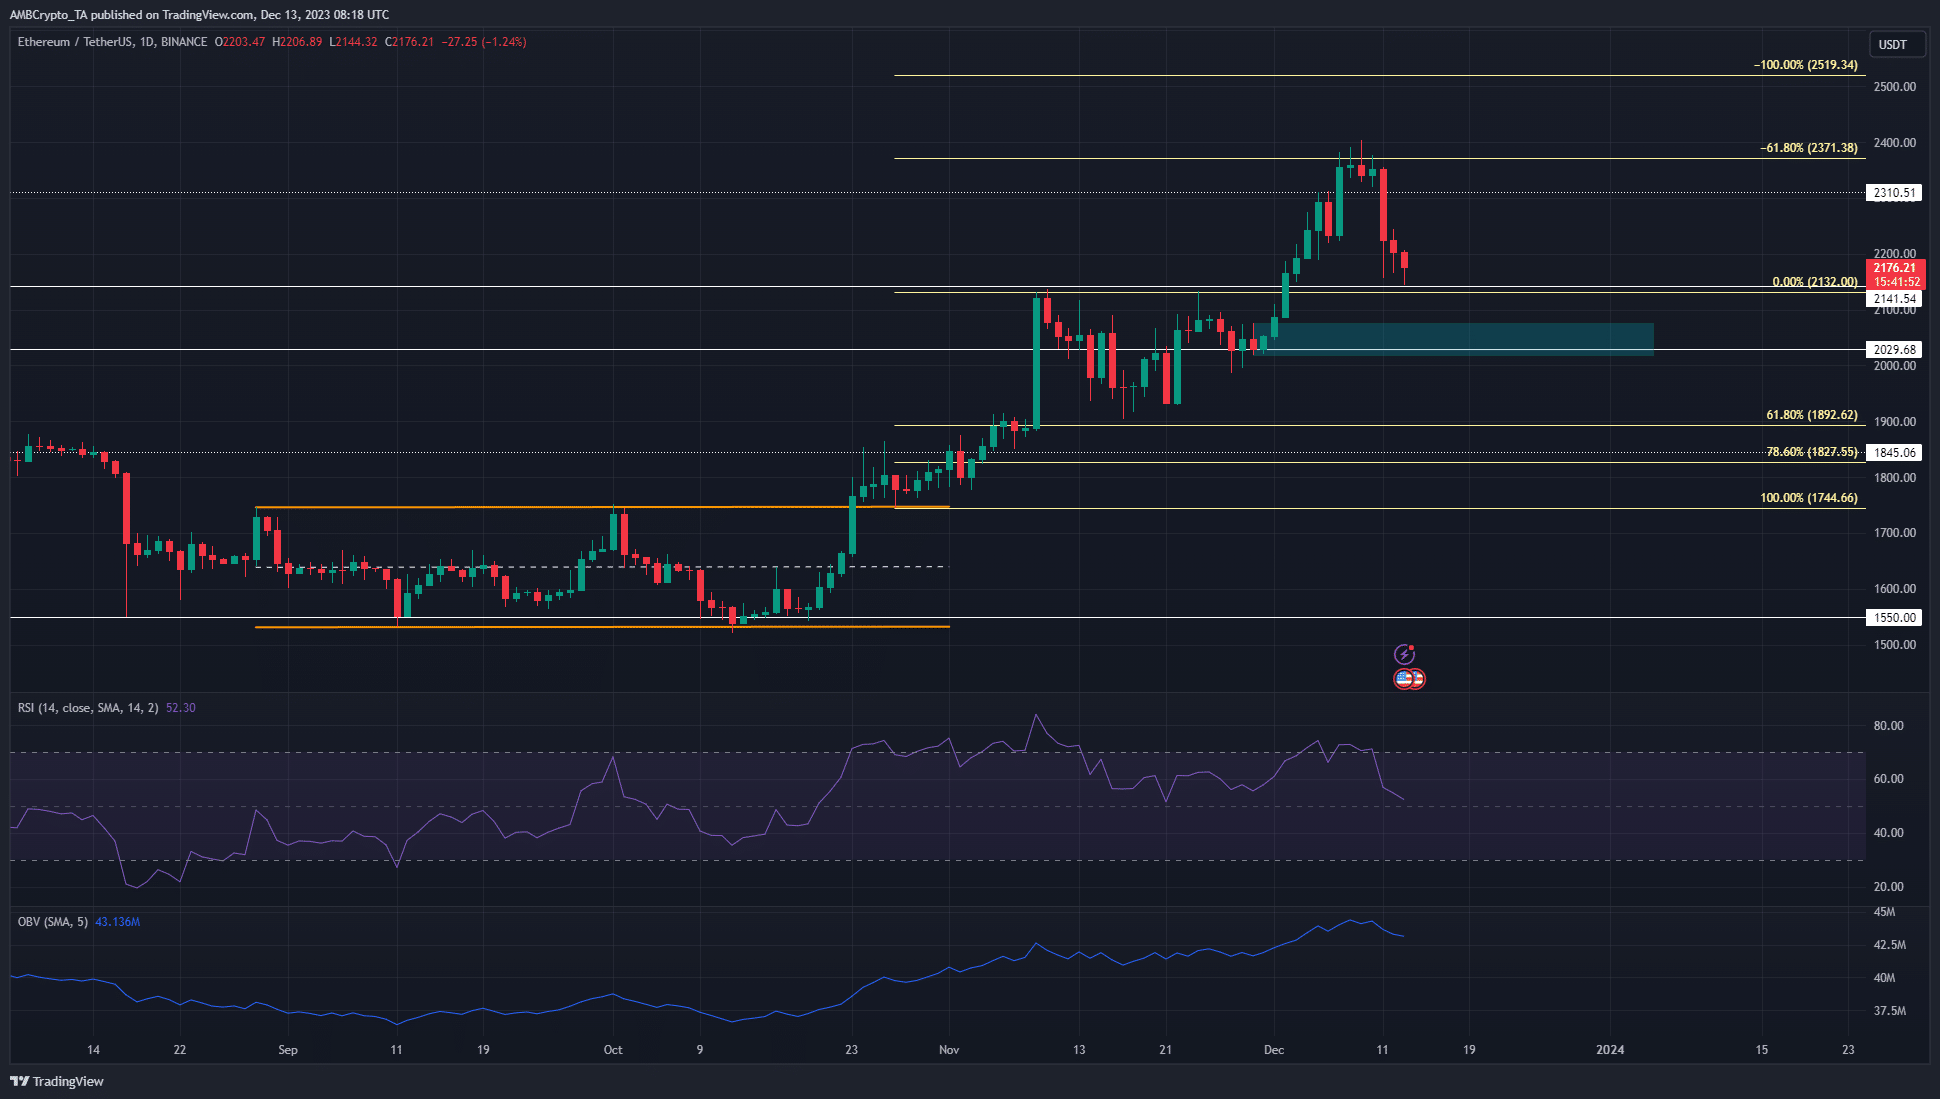
In early November, ETH shot skyward to reach $2130 and began to pull back thereafter. This retracement took nearly three weeks before Ethereum bulls were back in control.
They needed to capture the $2000 level as support and managed to do so and beat the local highs at $2130 afterward.
On the way higher, ETH took some time to consolidate at the $2030 region before the swift push northward. This region was highlighted in cyan. Combined with its proximity to the $2000 mark, it should serve as a strong support zone.
The $2019 level was the recent higher low, and a move beneath it would flip the one-day market structure bearishly. At press time, the RSI floated just above neutral 50 to denote bullish momentum.
The OBV was also in an uptrend, though it saw a dip in recent days.
These metrics signal caution

The age-consumed metric saw some notable spikes over the past two weeks. The most recent one arrived on the 10th of December when ETH was trading at $2340.
A couple of days later, the mean coin age, which had previously been in a strong uptrend, cratered. This suggested a lot of ETH had been moved between addresses. Combined with the age consumed, it suggested a spike in selling pressure.
Is your portfolio green? Check out the ETH Profit Calculator
This increased selling saw Ethereum prices fall toward the $2100 mark. Notably, the active addresses count began to falter over the past week. The MVRV ratio also reached a new high.
Holders whose ETH was in profit chose to sell their assets to realize some of these profits. Overall, the metrics suggested that long-term investors had reasons for concern.


