Ethereum, Shiba Inu, AAVE Price Analysis: 1 December

The broader crypto market signaled a revival trend as it shifted into its inherent state of volatility. As a result, Ethereum and AAVE registered over 6% gains on their daily charts.
On the other hand, Shiba Inu defied the market inclination by witnessing an 8.5% 24-hour loss.
Ethereum (ETH)
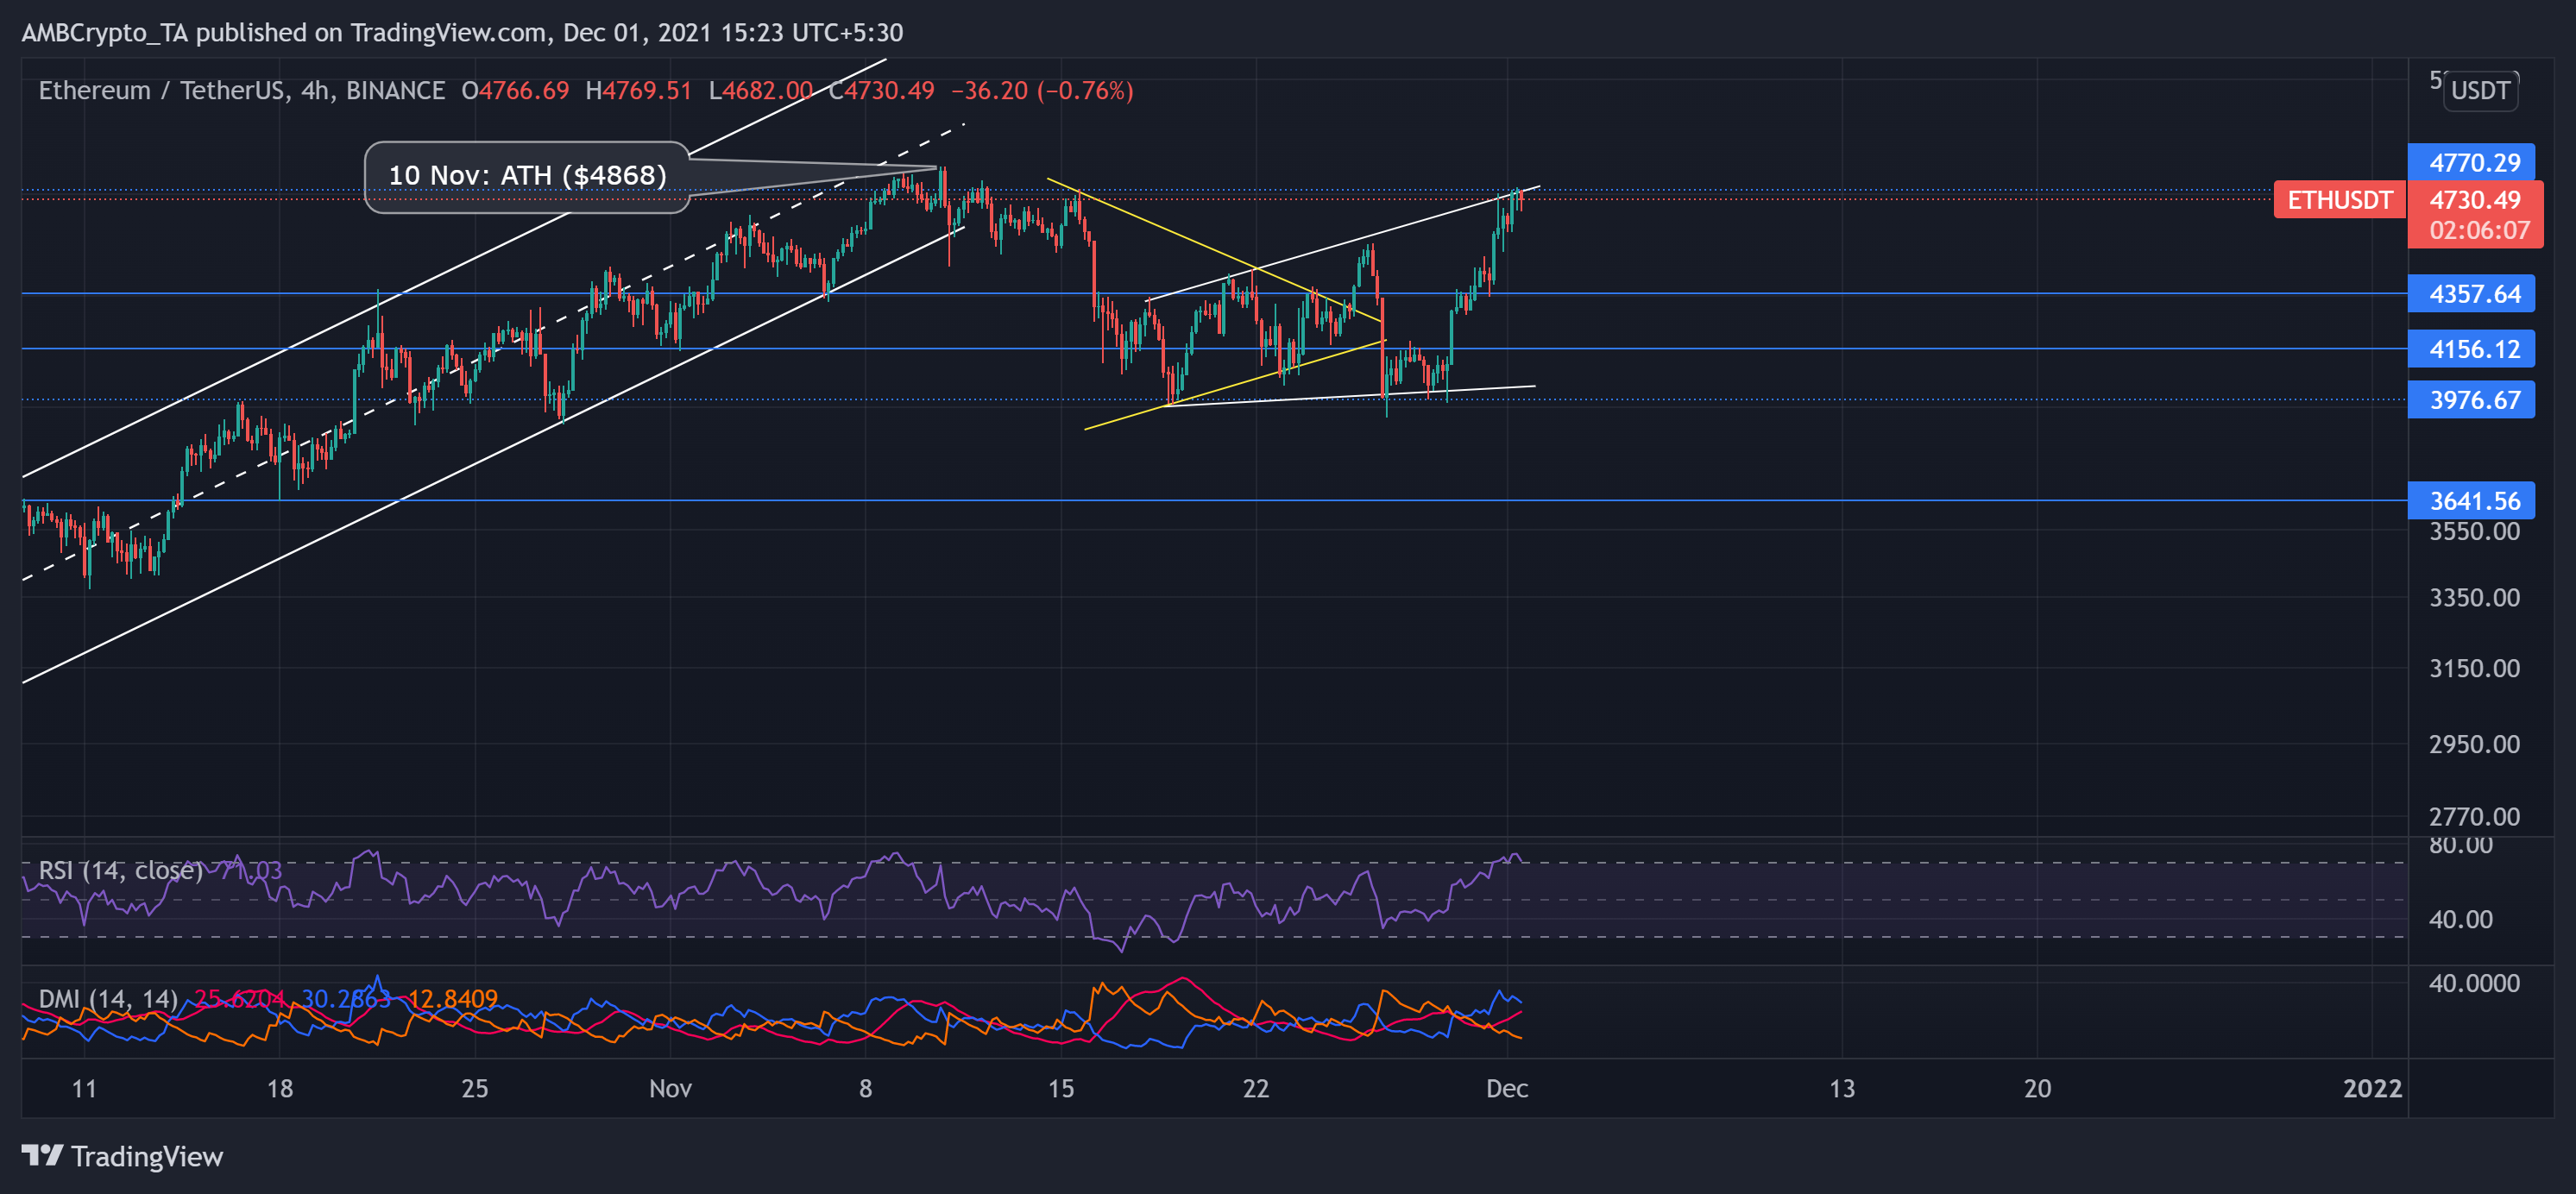
After striking its ATH, the bears triggered an over 19% decline (from 10 November) to touch the alt’s one-month low on 26 November. As a result, the price withdrew by marking a symmetrical triangle (yellow) after an up-channel breakdown.
However, bulls have ensured support at the $3,976-mark since the past month. Thus, the price upturned in an ascending broadening wedge to touch its two-week high on 1 December.
At press time, the alt traded at $4,730.49. The RSI was in the overbought region and displayed slowing signs. It might be in for a trend reversal. Further, DMI visibly showed a bullish preference. Considering the overbought RSI threat, the bulls will need to sustain their momentum to breach the immediate resistance at the $4,770-mark.
Shiba Inu (SHIB)
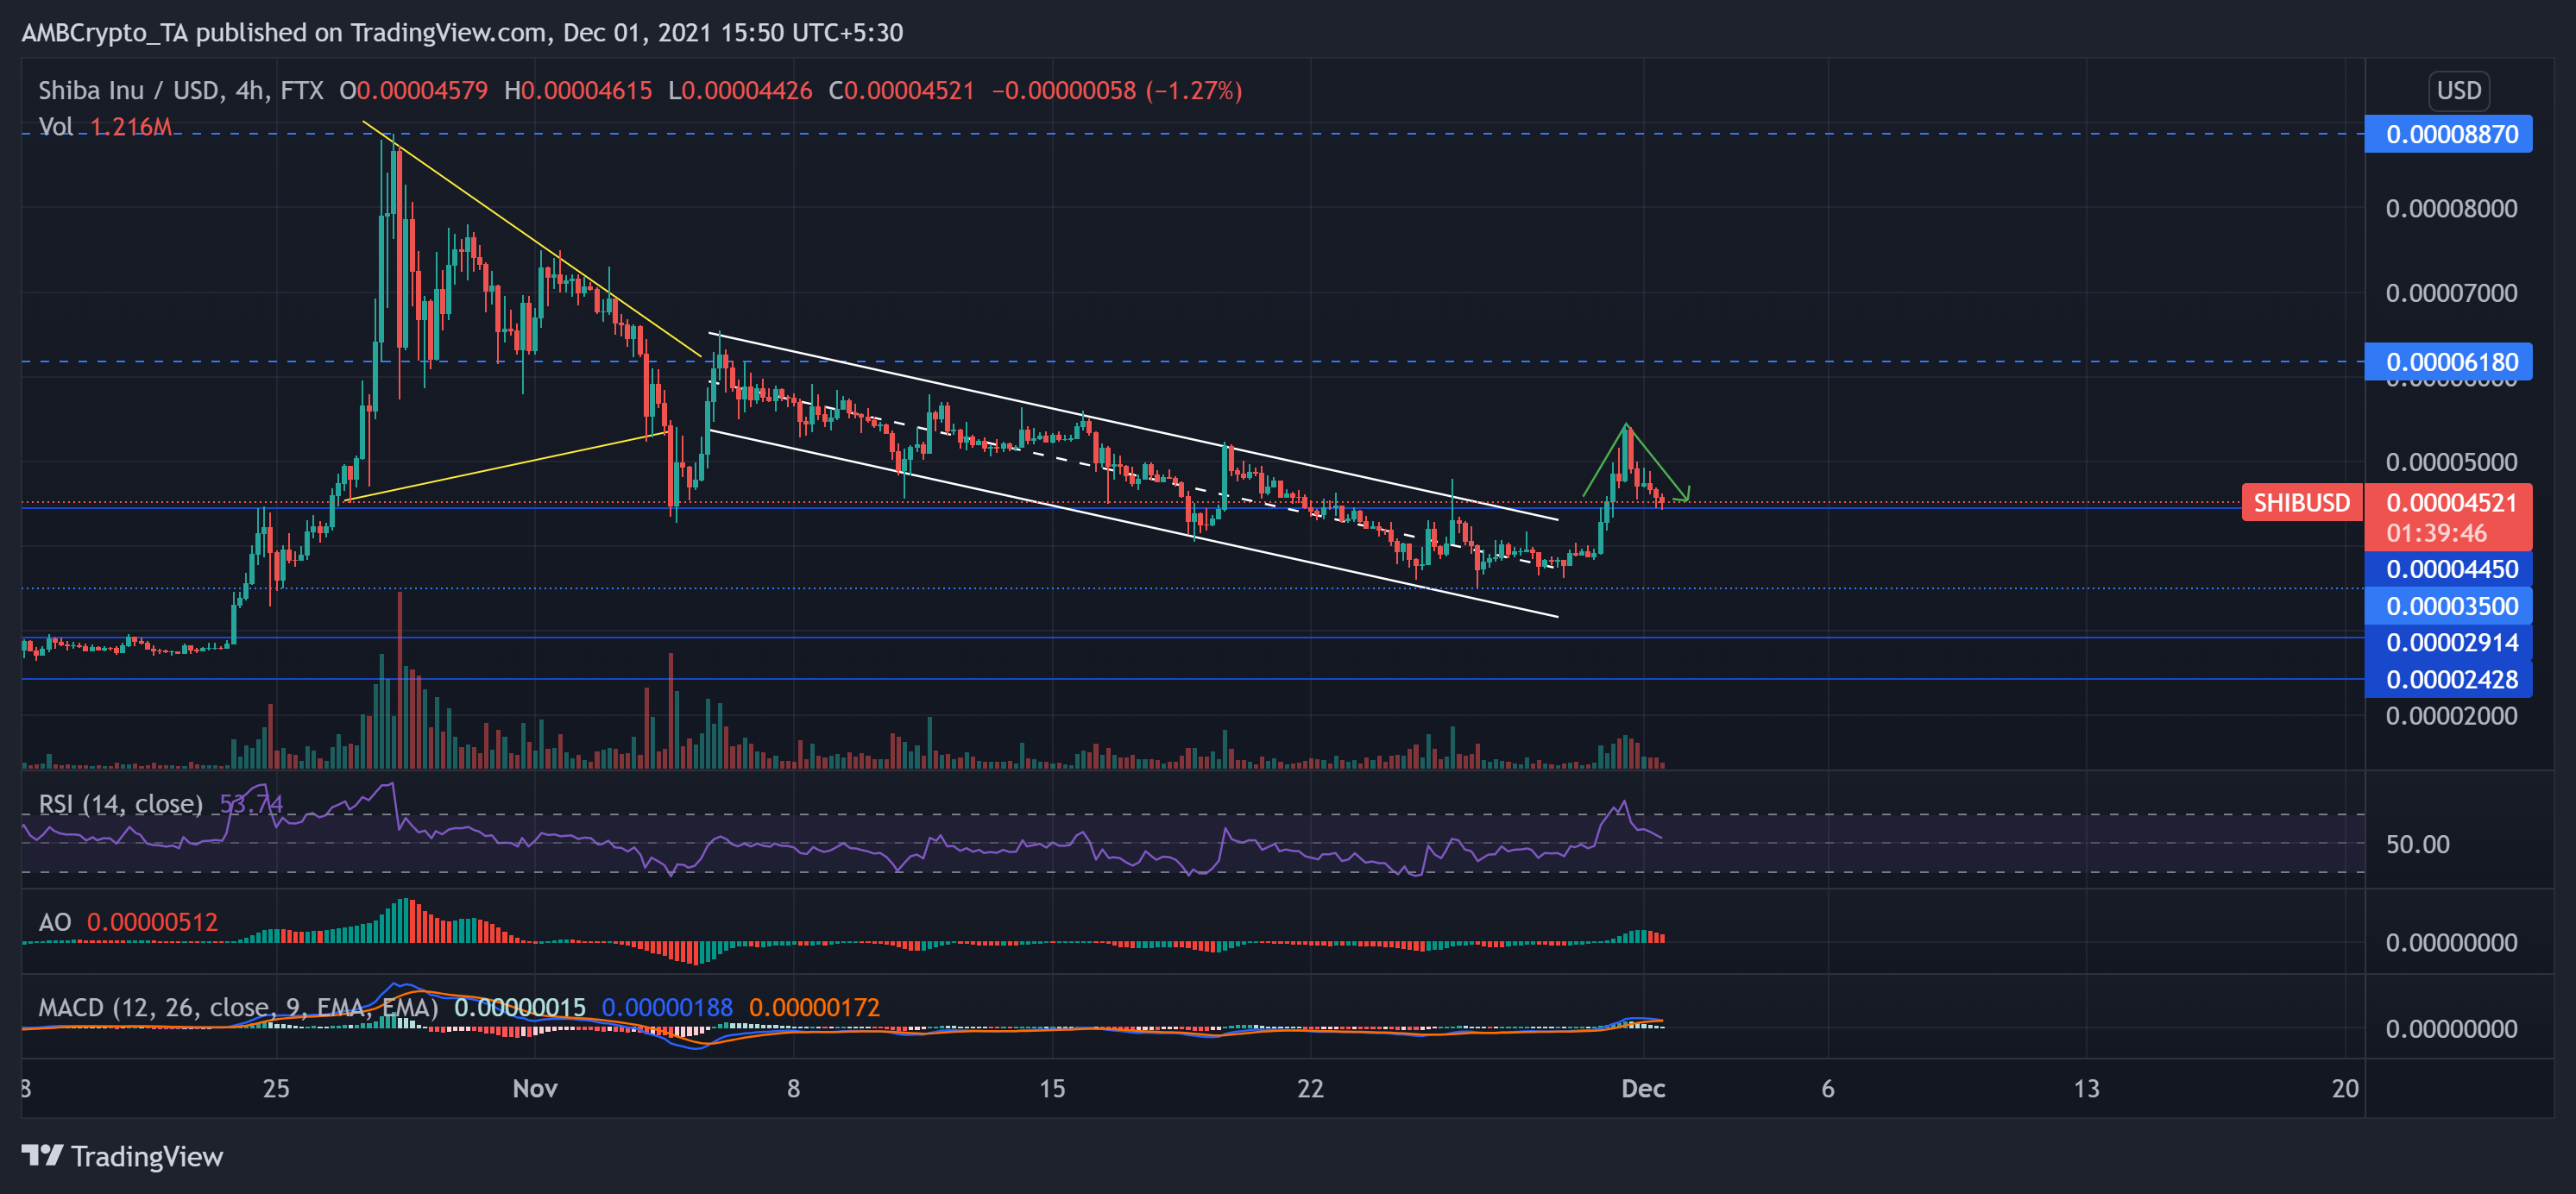
The meme coin has lost nearly half of its value since it struck its ATH on 28 October. After constant sell-off, bulls failed to hold their ground as the meme coin saw a 32.3% monthly decline. Consequently, SHIB touched its one-month low on 26 November.
Bulls ensured the crucial support at the $0.000035-mark. Consequent to which they triggered an uptrend which led to a down-channel breakout.
However, SHIB registered an 8.5% 24-hour loss and traded at $0.00004521, at press time. This pullback over the last day formed a V top (green) and possibly hinted at a reversal.
Over the past day, RSI plunged by 26 points from the overbought region. Further, AO and MACD reaffirm the decreasing bullish vigor. Now, to prevent a further reversal, SHIB bulls have to ensure support at $0.0000445.
AAVE
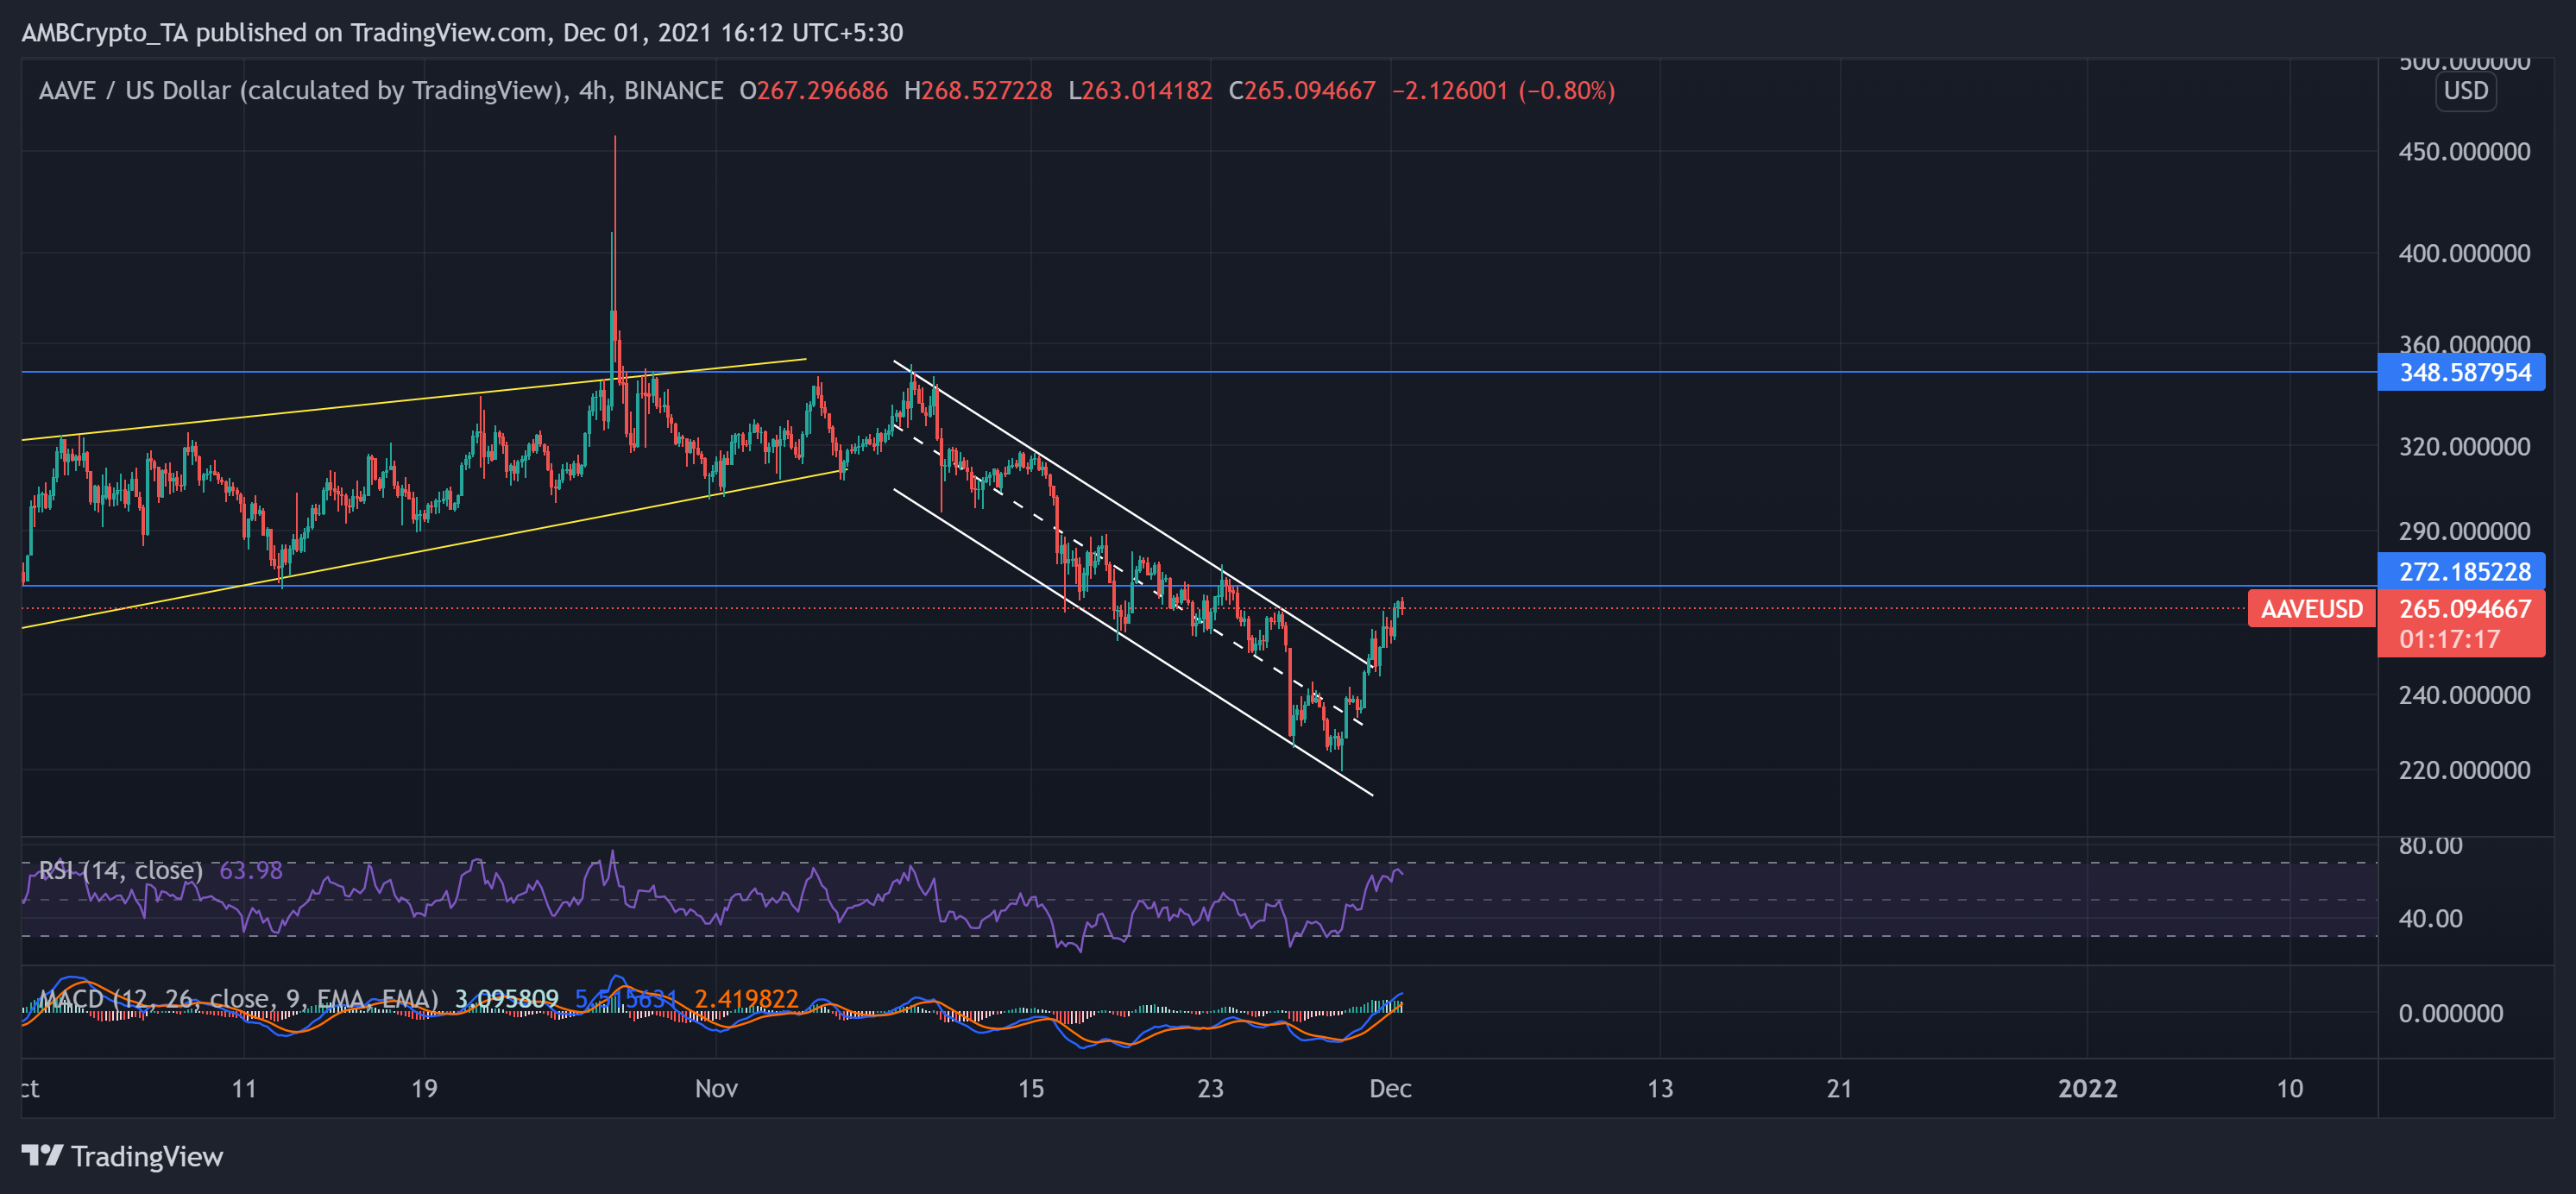
After rising in an ascending wedge since 22 September, AAVE poked its 23-week high at the $458-mark on 27 October.
Post a rising wedge breakdown on 9 November, the price steadily pulled out and oscillated in a down-channel (white). Since then, the bulls failed to counter the selling pressure, as AAVE lost over one-third of its value to touch its four-month low on 28 November.
However, the alt noted a 7.17% 24-hour increase and traded at $265.09 at press time. This upturn led to a down-channel breakout. Hence, the near-term technicals flashed a bullish preference.
The RSI stood at the 63-mark but showed slowing signs. Also, the MACD preferred the bulls but hinted at a slight decrease in their power. Now, the bears might continue to resist at the $272-mark for a while if the bulls can’t propel an upturn.


