Ethereum, Shiba Inu, Basic Attention Token Price Analysis: 26 November

As Bitcoin hit the $54,000-mark, the market slumped by marking over a 5% decline in the last 24 hours. Consequently, Ethereum and Shiba Inu correlated the bearish tendencies by marking a steady downfall in November.
On the other hand, BAT continued its uptrend and saw a 21.8% gain over the past day.
Ethereum (ETH)
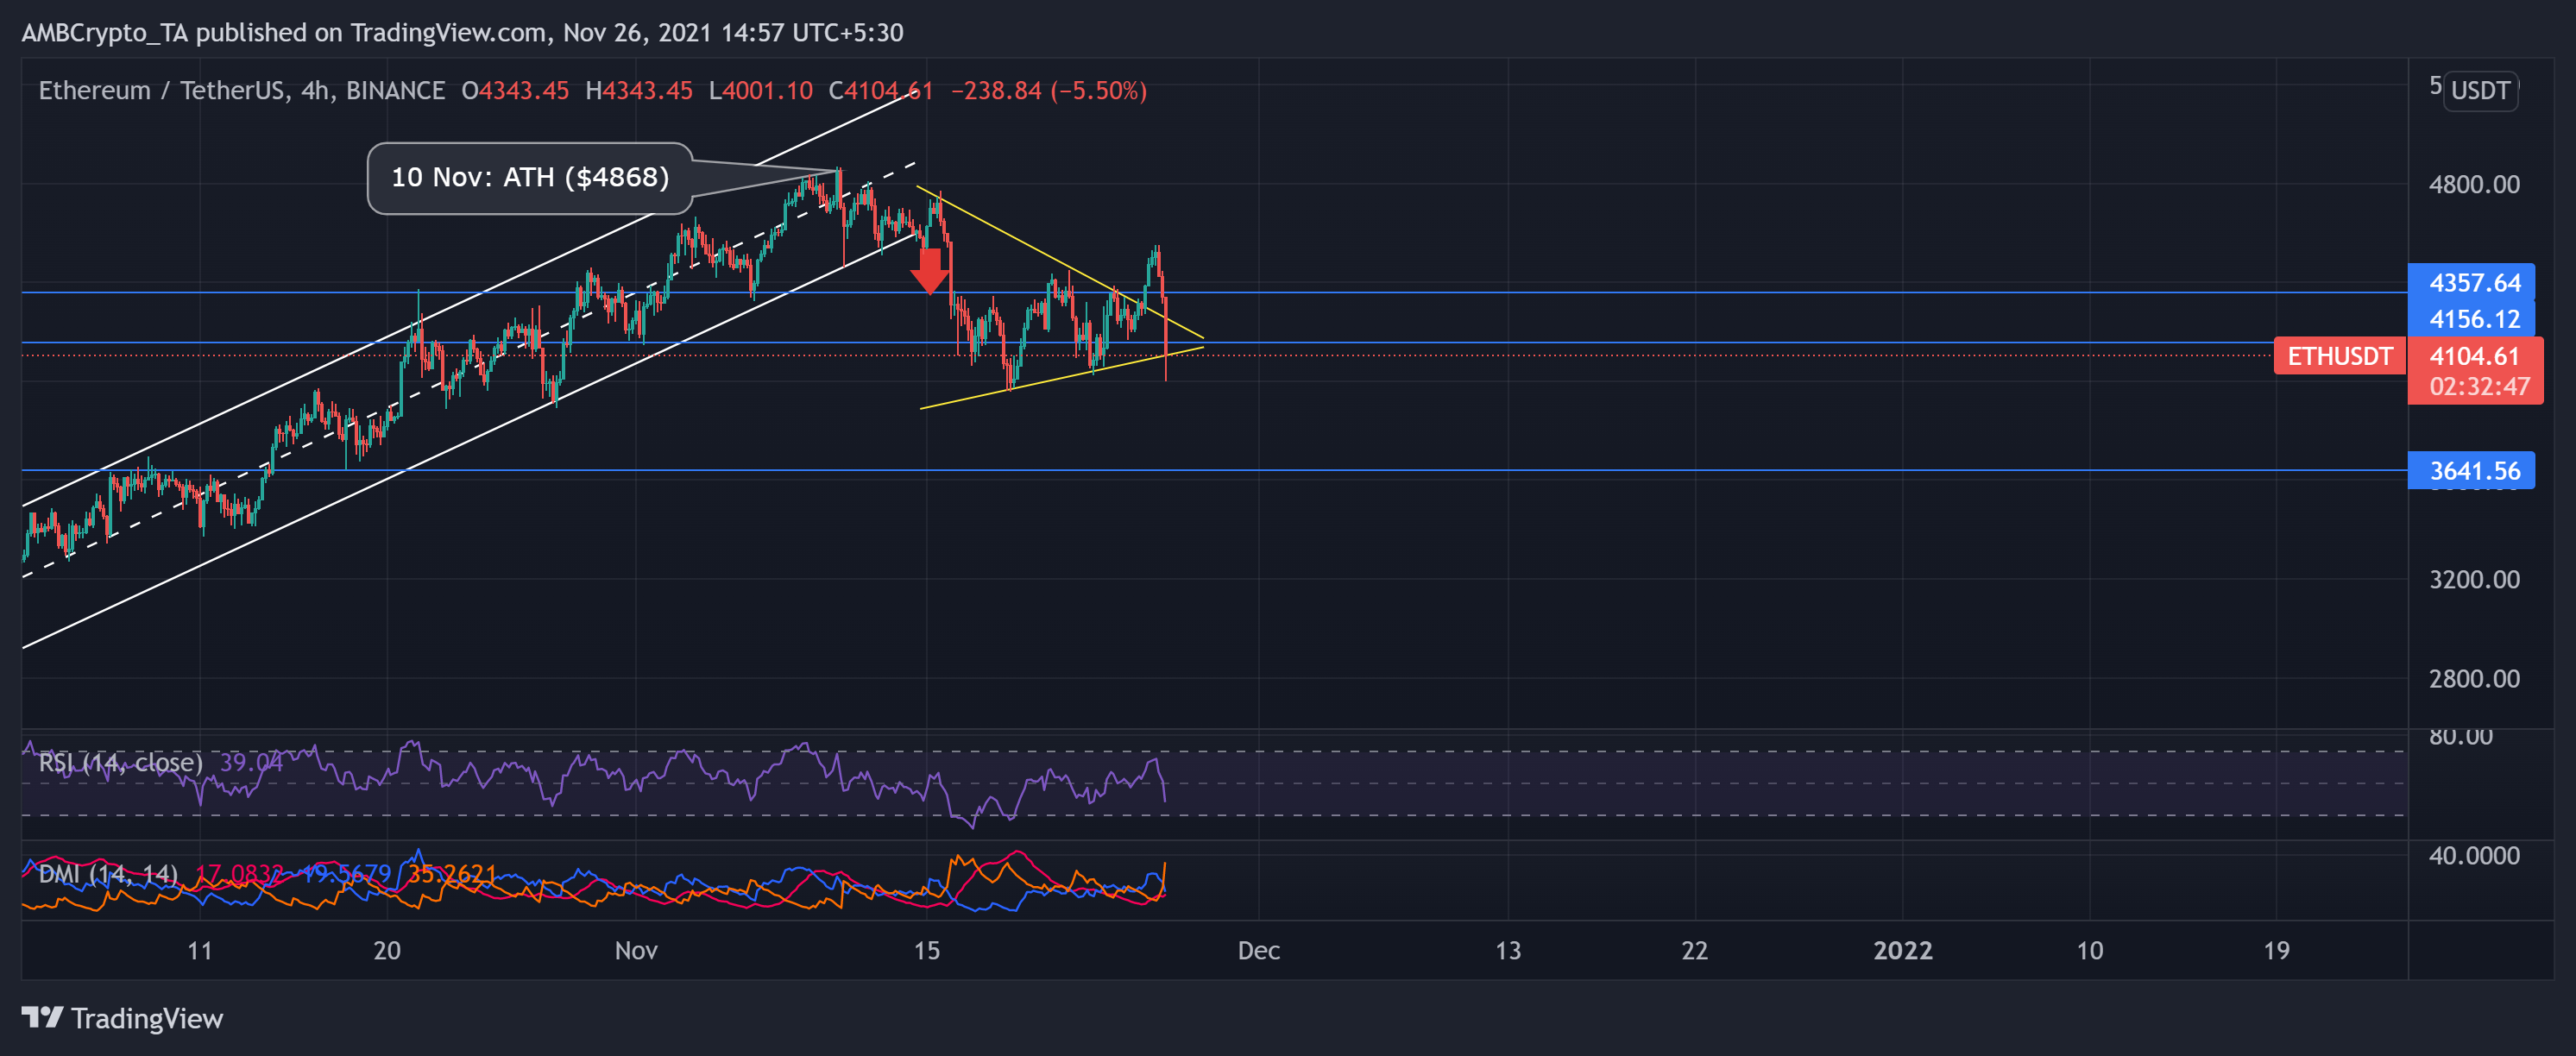
Bitcoin retraced after striking its ATH on 10 November. Likewise, ETH suspended its upswing rally from that day. The largest alt registered over 61% ROI (from 22 September) to touch its ATH on 10 November at $4,868.
Then, as the bulls slowed down, bears took over by triggering an over 18% decline (from 10 November). As a result, the price action withdrew by marking a bearish pennant pattern (yellow) and touched its three-week low on 18 November after breaching the northern trend.
Although bulls tried to counter the sell-off, they were unable to maintain the $4,156-mark. At press time, the alt traded at $4,104.61 after a 6.4% 24-hour loss. The RSI was southbound and favored the bears at the 38-mark. Further, the DMI showed a one-sided preference for the bears. However, the ADX displayed a weak directional trend.
Shiba Inu (SHIB)
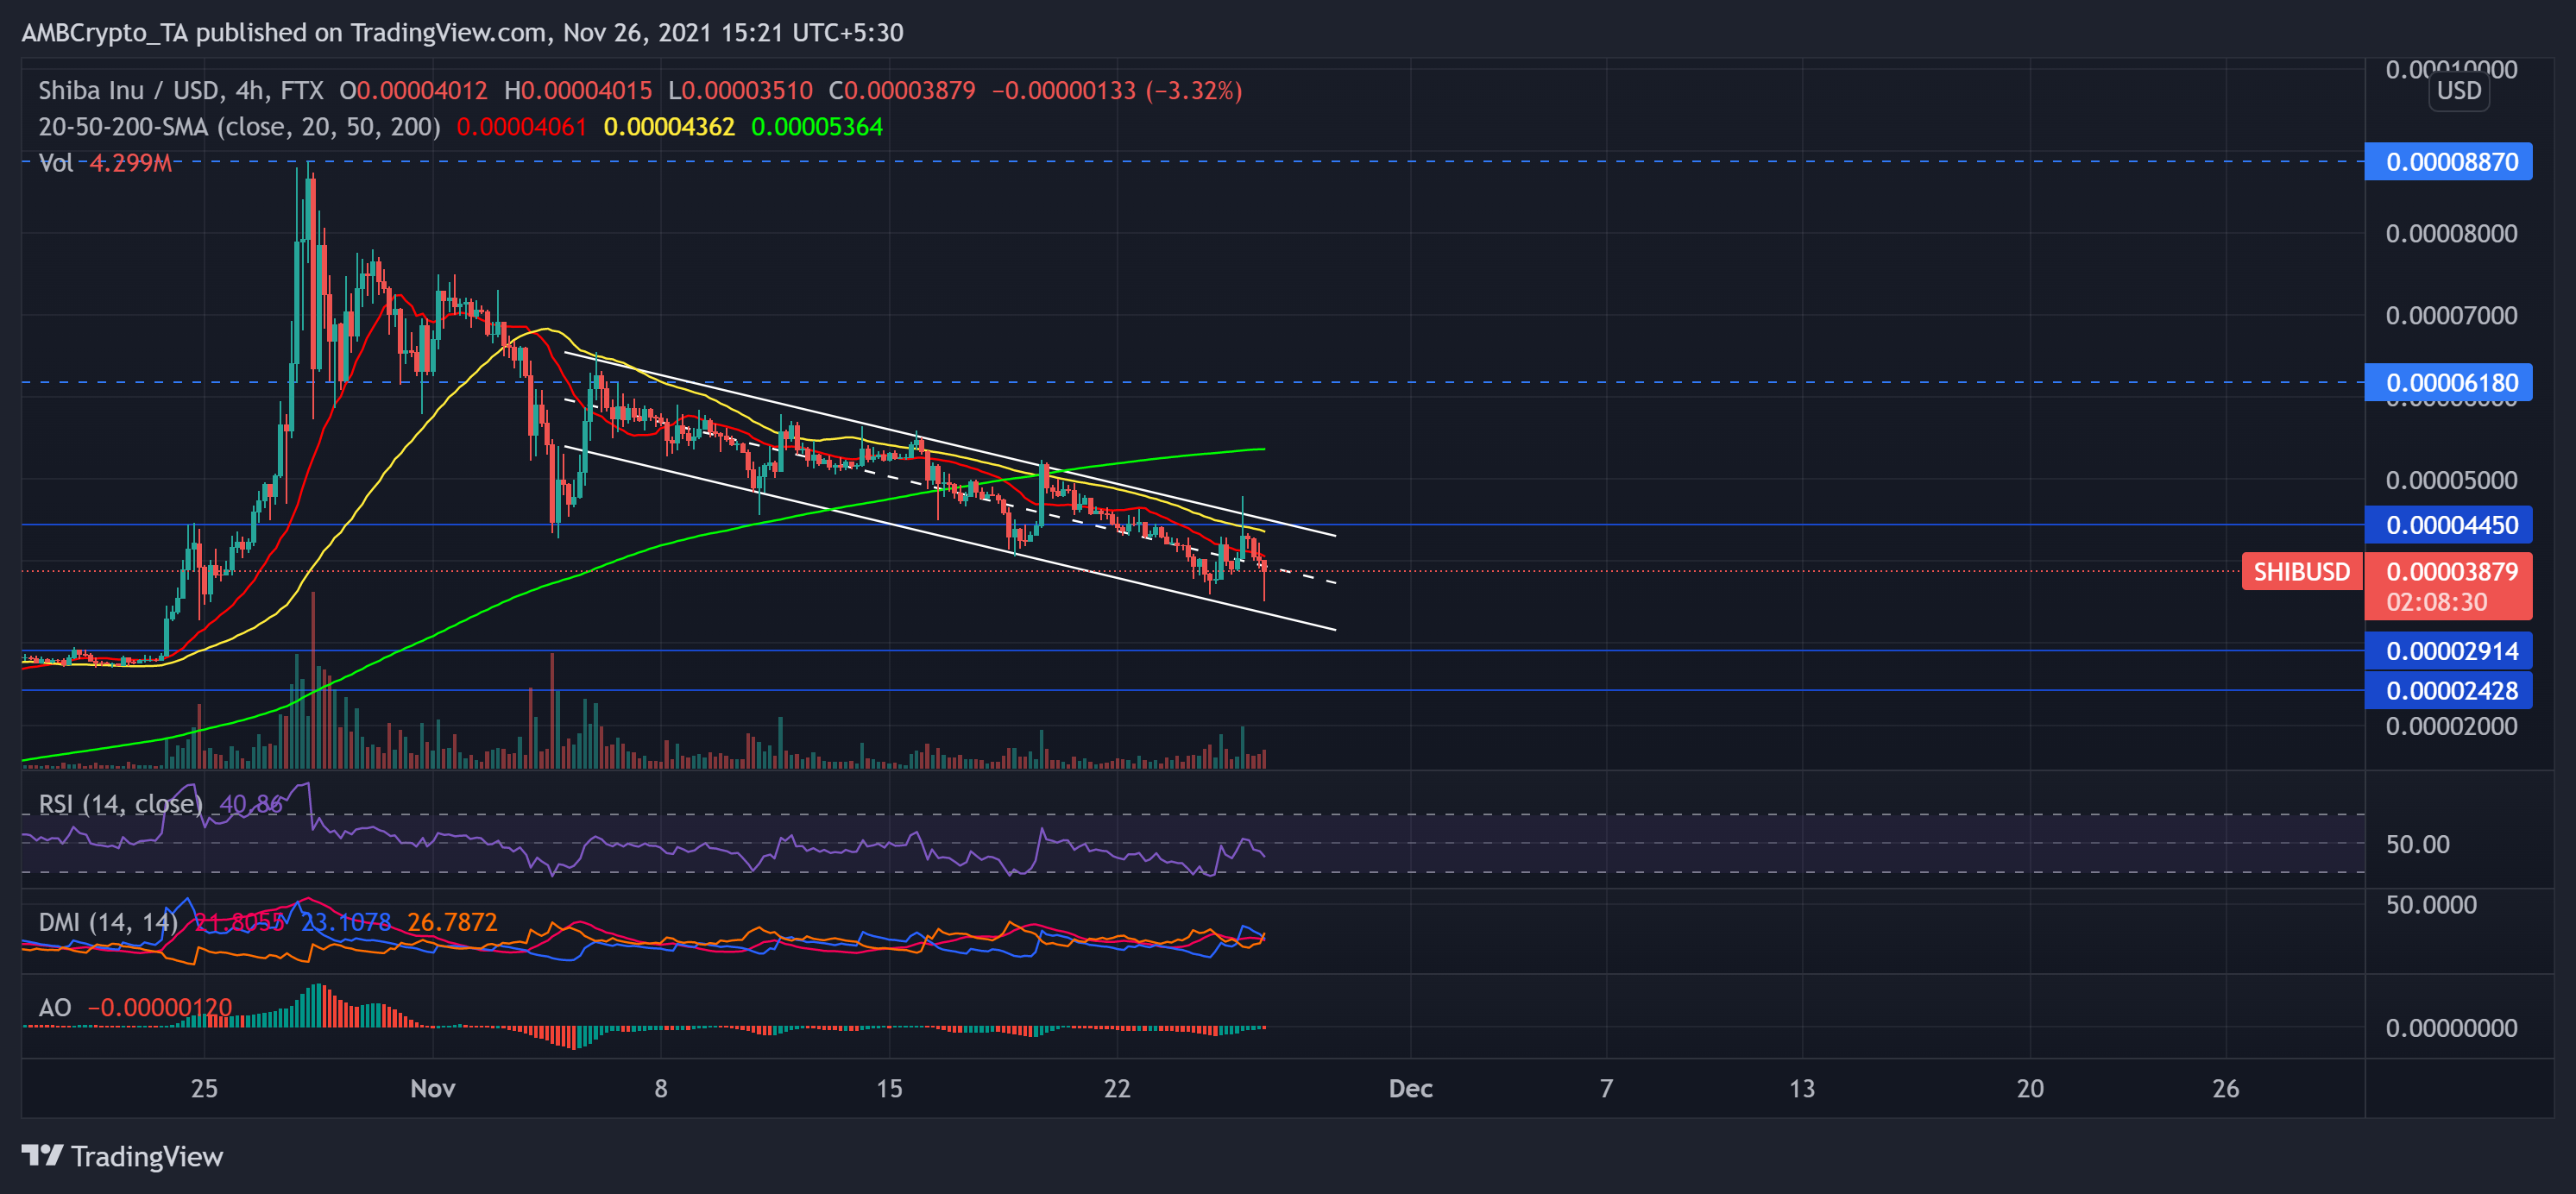
SHIB descended in a down channel throughout this month. The meme coin has lost more than half of its value since it struck its ATH on 28 October.
However, on 19 November, SHIB saw a nearly 13.76% jump to $0.00005236. But possibly with increased profit-taking, bulls failed to hold their ground as the coin saw a 25.56% decline in just seven days. Consequently, it touched its one-month low on 26 November.
Despite this trajectory, SHIB army managed to grow to over a million holders as per Etherscan. At press time, SHIB traded at $0.00003879. The price transacted below its 4-hour 20-50-200 SMA, indicating the existence of bearish influence.
The RSI seemed to head south after preferring the bears. Also, the DMI chose the sellers after depicting their increased vigor. Nevertheless, the ADX displayed a weak directional trend.
Basic Attention Token (BAT)
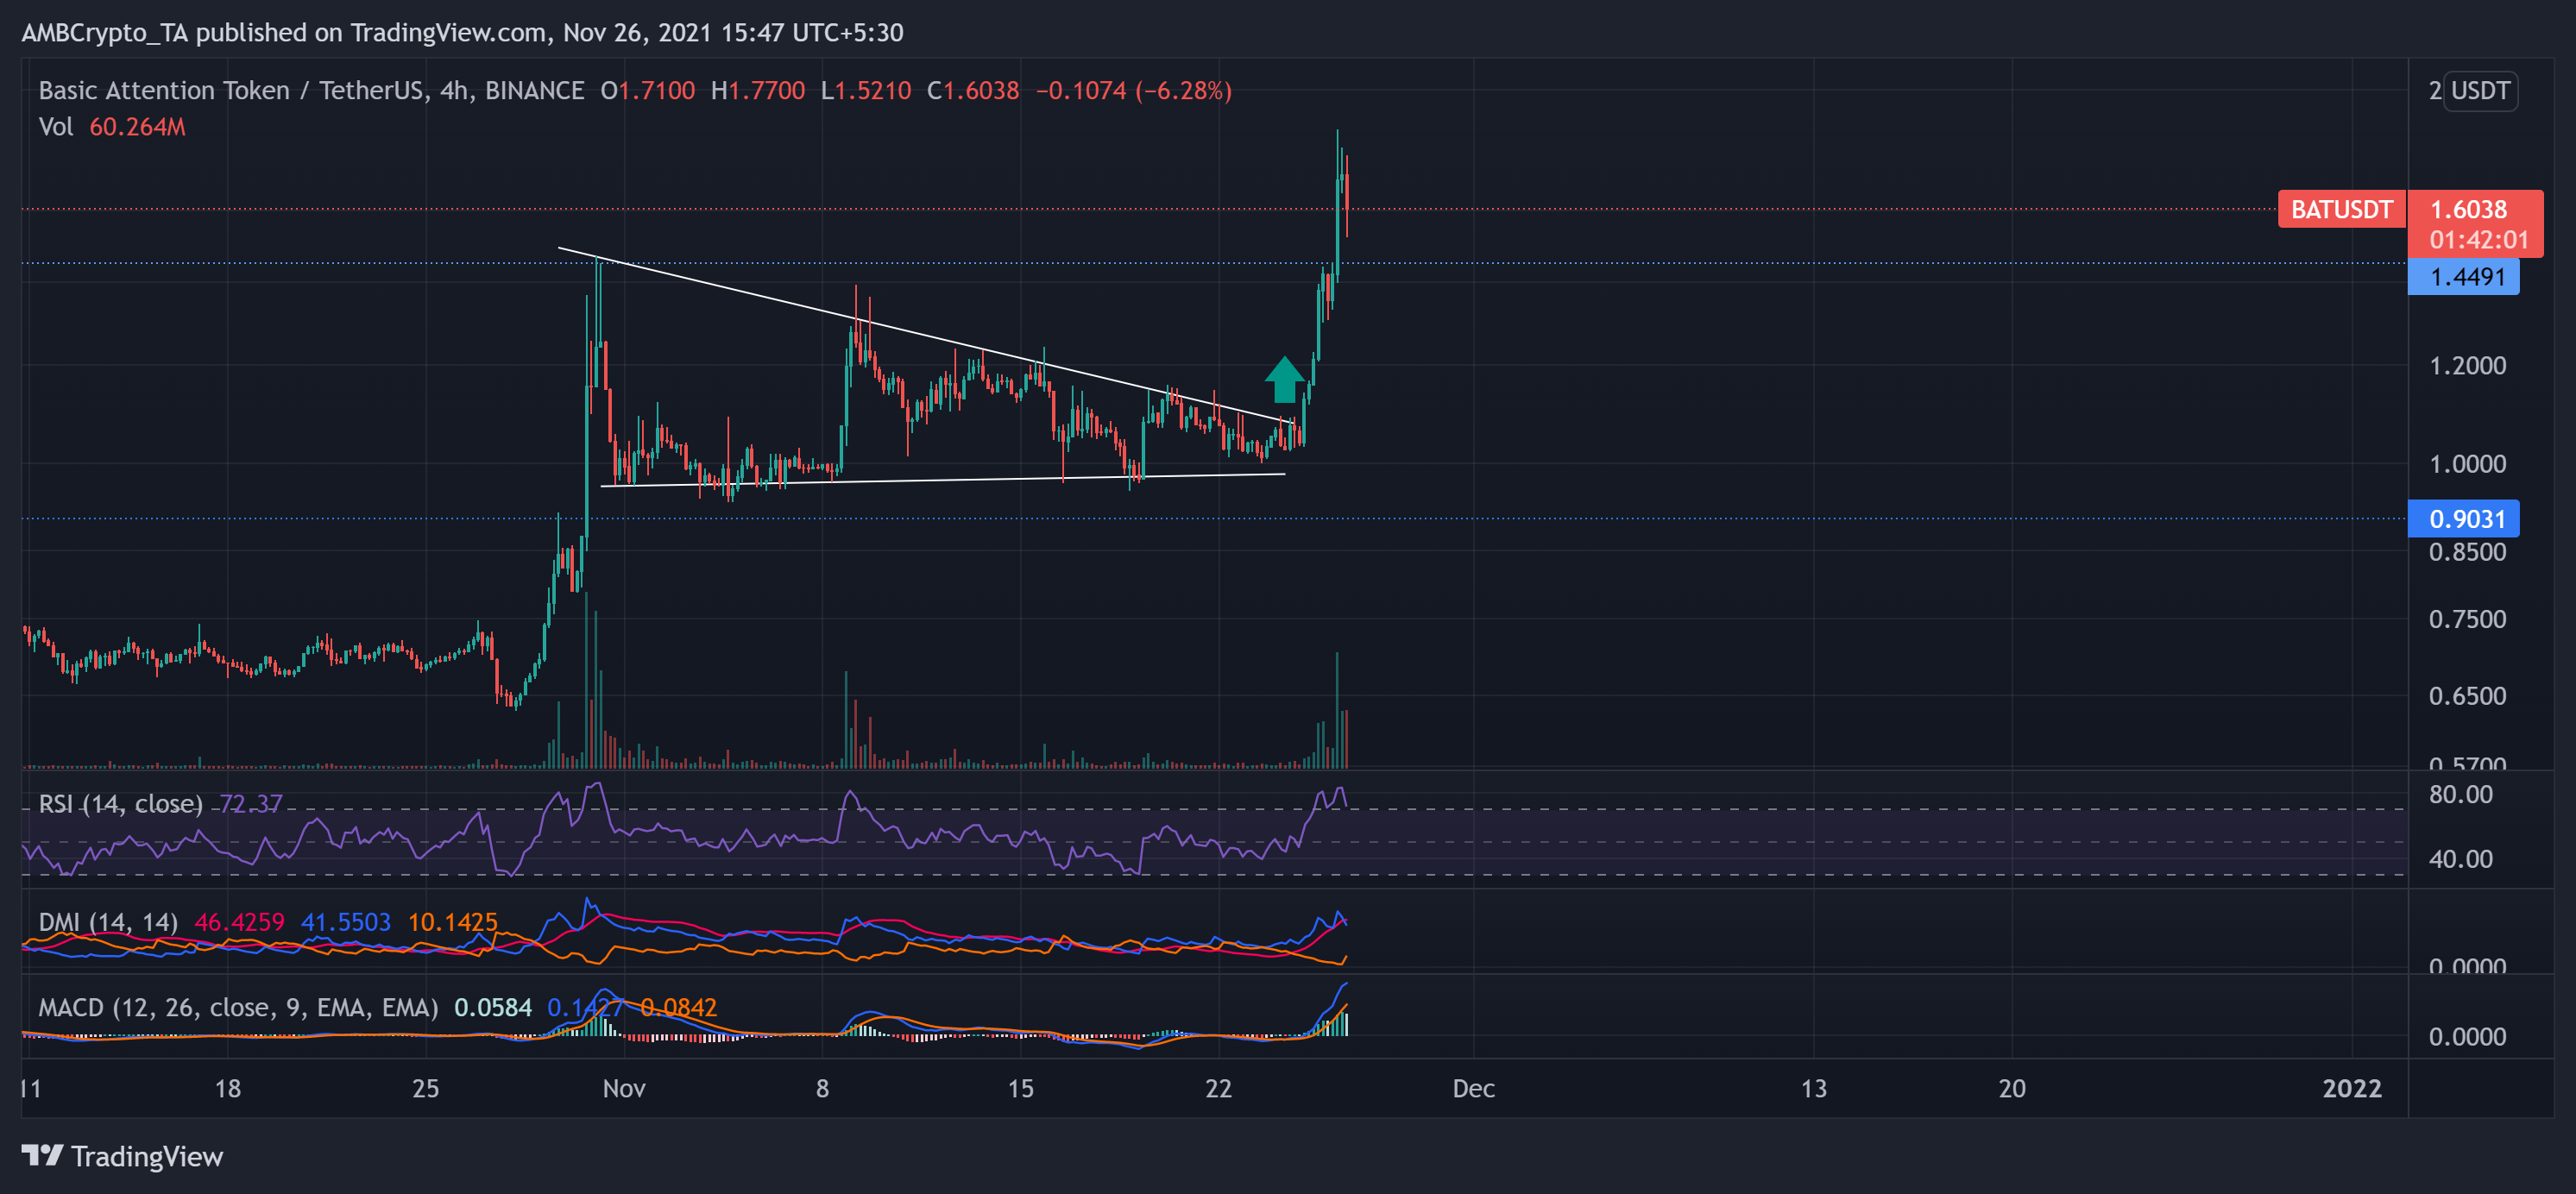
BAT witnessed an aggressive growth over the past month by noting a 121.8% ROI (monthly). Since 28 October, the bulls triggered an uptrend as the price saw exponential gains. Consequently, it rallied to poke its 24-week high on 30 October at $1.4685.
However, since 31 October, the bears displayed their vigor as the price action withdrew in a descending triangle. This phase marked a 29.13% retracement. Nevertheless, the bulls did not lose their ground and further propelled the price action by over 75% in just two days.
As a result, the altcoin touched its ATH on 26 November, backed with high trading volumes. At press time, BAT traded at $1.54. The RSI stood at the overbought region and showed slowing signs. Further, DMI and MACD readings depicted a preference for the bulls but hinted at their decreasing strength.