
Ethereum has been witnessing a correction in its value and most altcoins have been mirroring this trend in their market. Altcoins like Stellar Lumens [XLM] and Cosmos [ATOM] have been witnessing a similar price trend.
Ethereum [ETH]
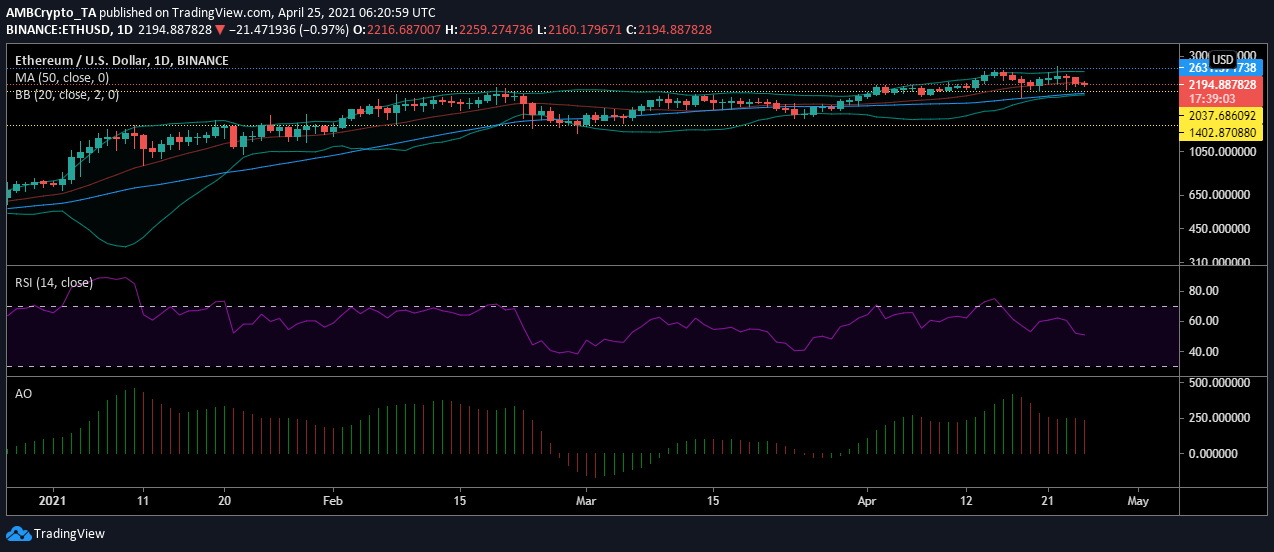
Source: ETHUSD on TradingView
The above chart of Ethereum was showing a price correction at $2,172. The price recently hit an all-time high at $2,674 on 22 April, after which it has been trending lower. The price was now approaching the support at $2,037 but the market has remained slightly bullish.
Although the value of ETH was depreciating, the Bollinger bands were indicating steady volatility. Whereas, the signal line had remained indecisive of its next move. The selling has helped the digital asset return from the overbought zone to the equilibrium zone. This indicated that the price was trying to achieve stability.
As the momentum reduces, we may witness Ether consolidate at the present level.
Stellar Lumens [XLM]
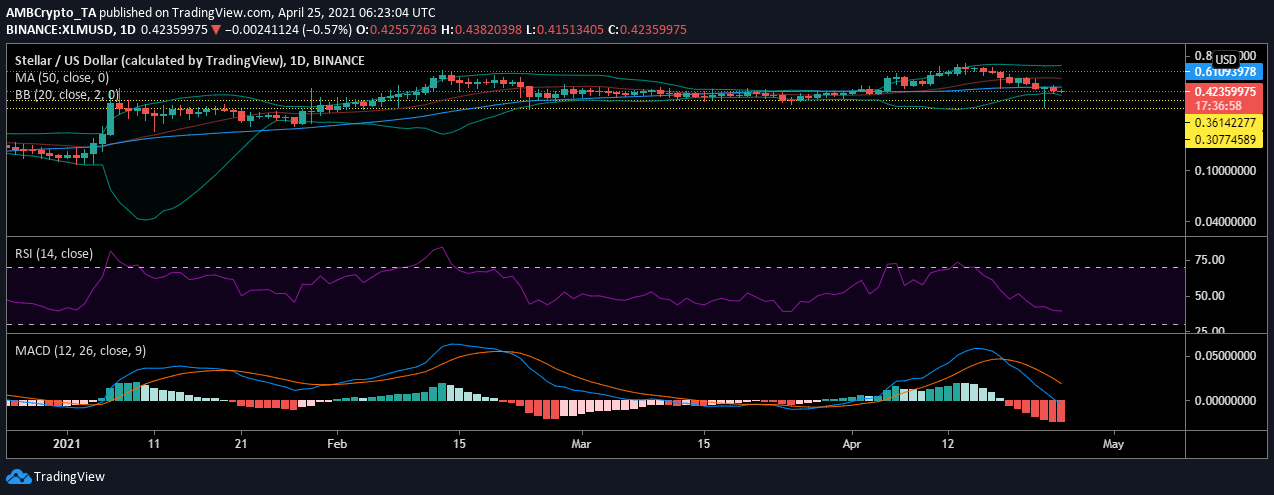
Source: XLMUSD on TradingView
The Stellar Lumen’s [XLM] chart suggested that the asset had recently broken out of a long period of consolidation to witness a surge. However, the market could not hold on to a high value of $0.6982 and plunged to $0.4199, at the time of press.
This volatile behavior of the asset has given bears the leverage and the signal line crossed over the candlesticks. The selling pressure is higher at the moment and this was indicated by the relative strength index. Meanwhile, the MACD line also crossed under the signal line suggesting the rise of sellers in the market hinted at the continuation of this trend.
Cosmos [ATOM]

Source: ATOMUSD on TradingView
The Cosmos [ATOM] market saw its value appreciate in February and then move into a consolidation phase. However, while the rest of the market was witnessing a correction, ATOM held on to its value and continued to move sideways. At press time, ATOM was still holding on to $18.25 as selling pressure evolved.
The support was strong at $16.44 and has been a point of price reversal. Even as the sell-off pushes the price to this support, there was a high possibility for the trend and price to turn around. The rise in selling pressure has pushed ATOM under the equilibrium zone, but the bullishness has sustained in the market.
This was due to the money flowing in the ATOM market and was affirmed by the Chaikin money flow that remained well above zero and ATOM’s price may move along the current price level to gain stability.