Ethereum, Stellar Lumens, FTX Token Price Analysis: 03 January

Ethereum was strongly bullish on the charts as the dip to $700 never came, but instead, a boost to $789 was noted on the charts. Stellar Lumens slumped in the face of sellers, while FTX Token also surged and was trading at $6.38.
Ethereum [ETH]

Sorry: ETH/USD on TradingView
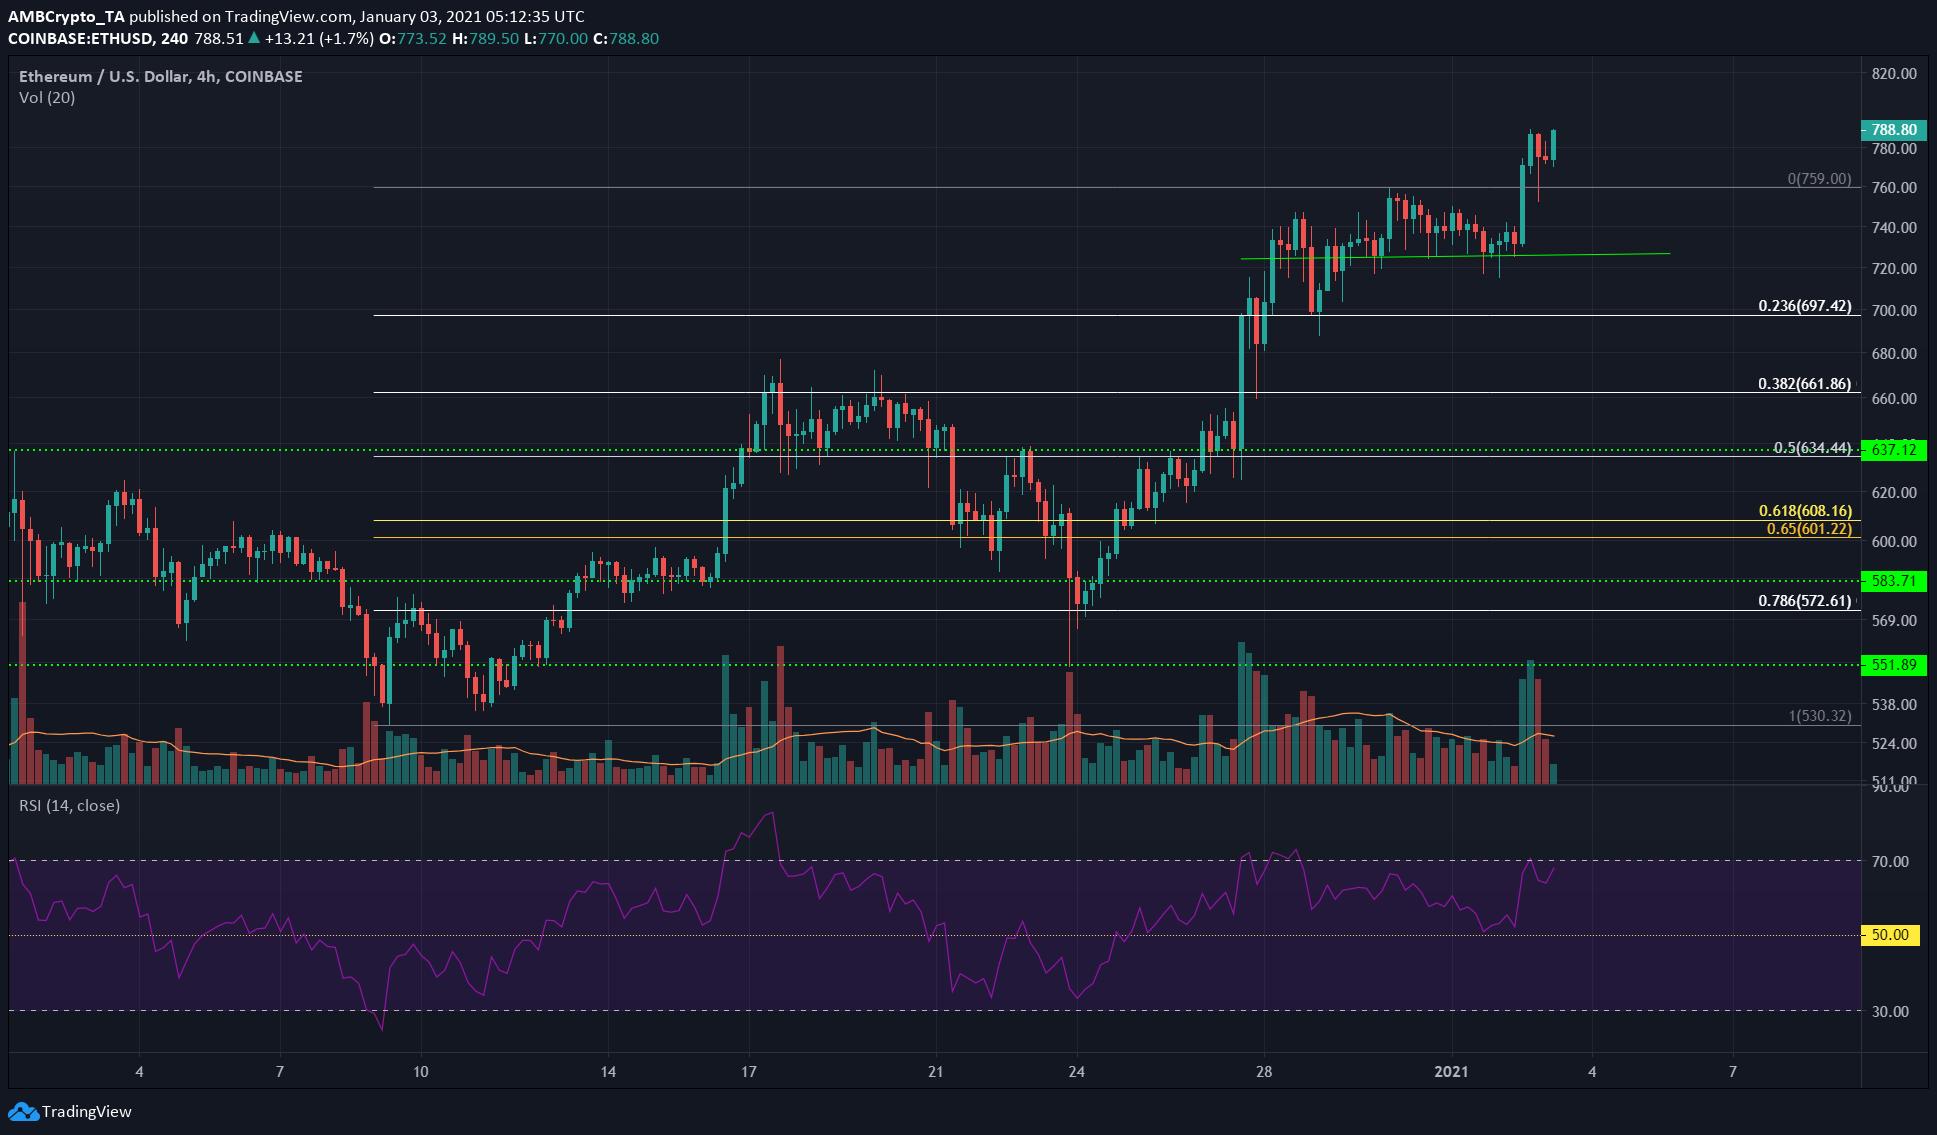
Ethereum had a strongly bullish outlook on the charts. The price did not dip beneath the $725 mark, which 24 hours ago could have seen ETH visit $700.
On the contrary, Bitcoin’s gains were mirrored by Ether and it surged past the previous high at $759 and retested that region as well, and was trading at $788 at the time of writing.
The RSI did not dip beneath neutral 50, indicating an uptrend in progress. Using the Fibonacci tool for ETH’s swing high and swing low of the past month, a 27% extension projected a target of $836 for ETH.
Stellar Lumens [XLM]

Source: XLM/USD on TradingView
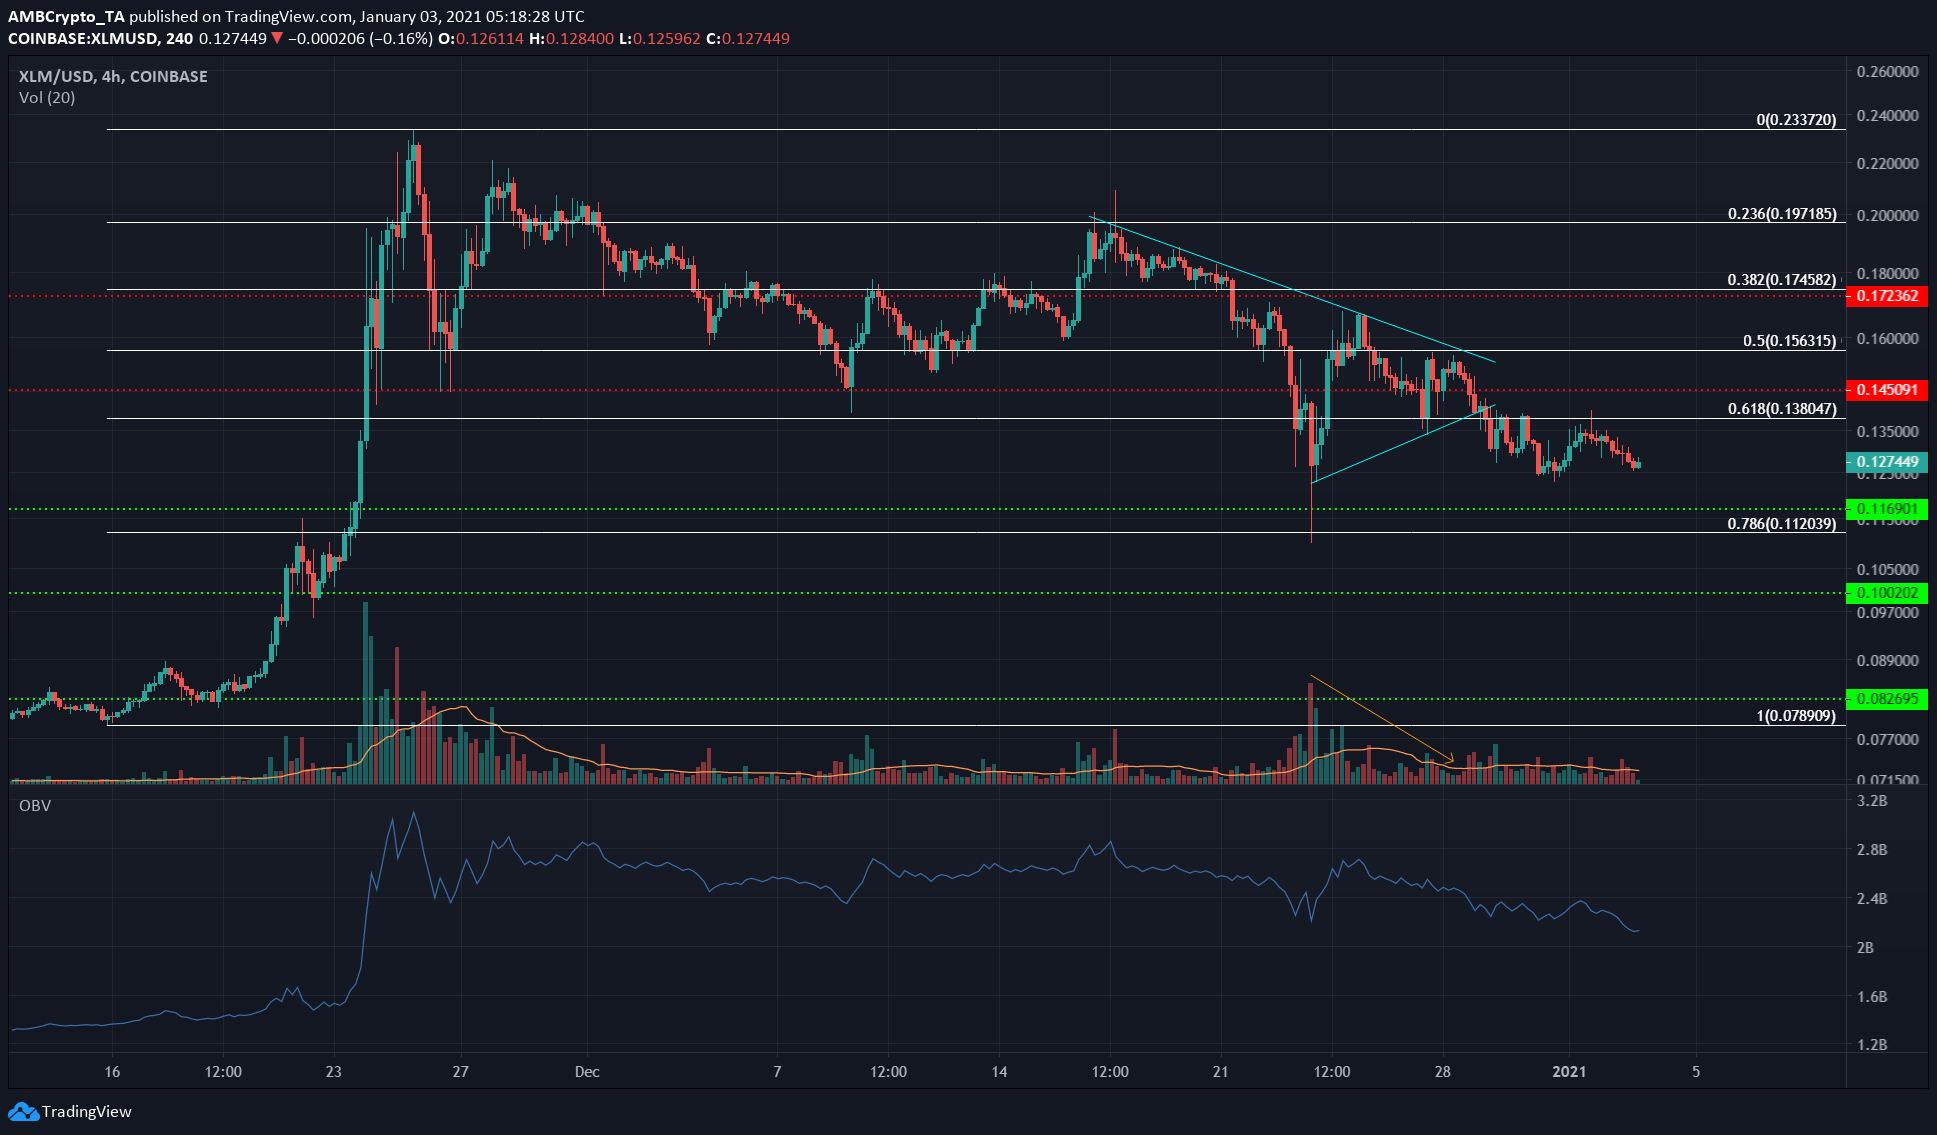
XLM closed beneath the symmetrical triangle it formed and continued its descent past levels of horizontal support. The 61.8% retracement level was ceded to the bears as well.
The OBV showed continued selling behind XLM and the price was likely to head toward the 78.6% retracement level at $0.112 to find some buyers, with $0.116 being a level of interest as well.
FTX Token [FTT]

Source: FTT/USD on TradingView
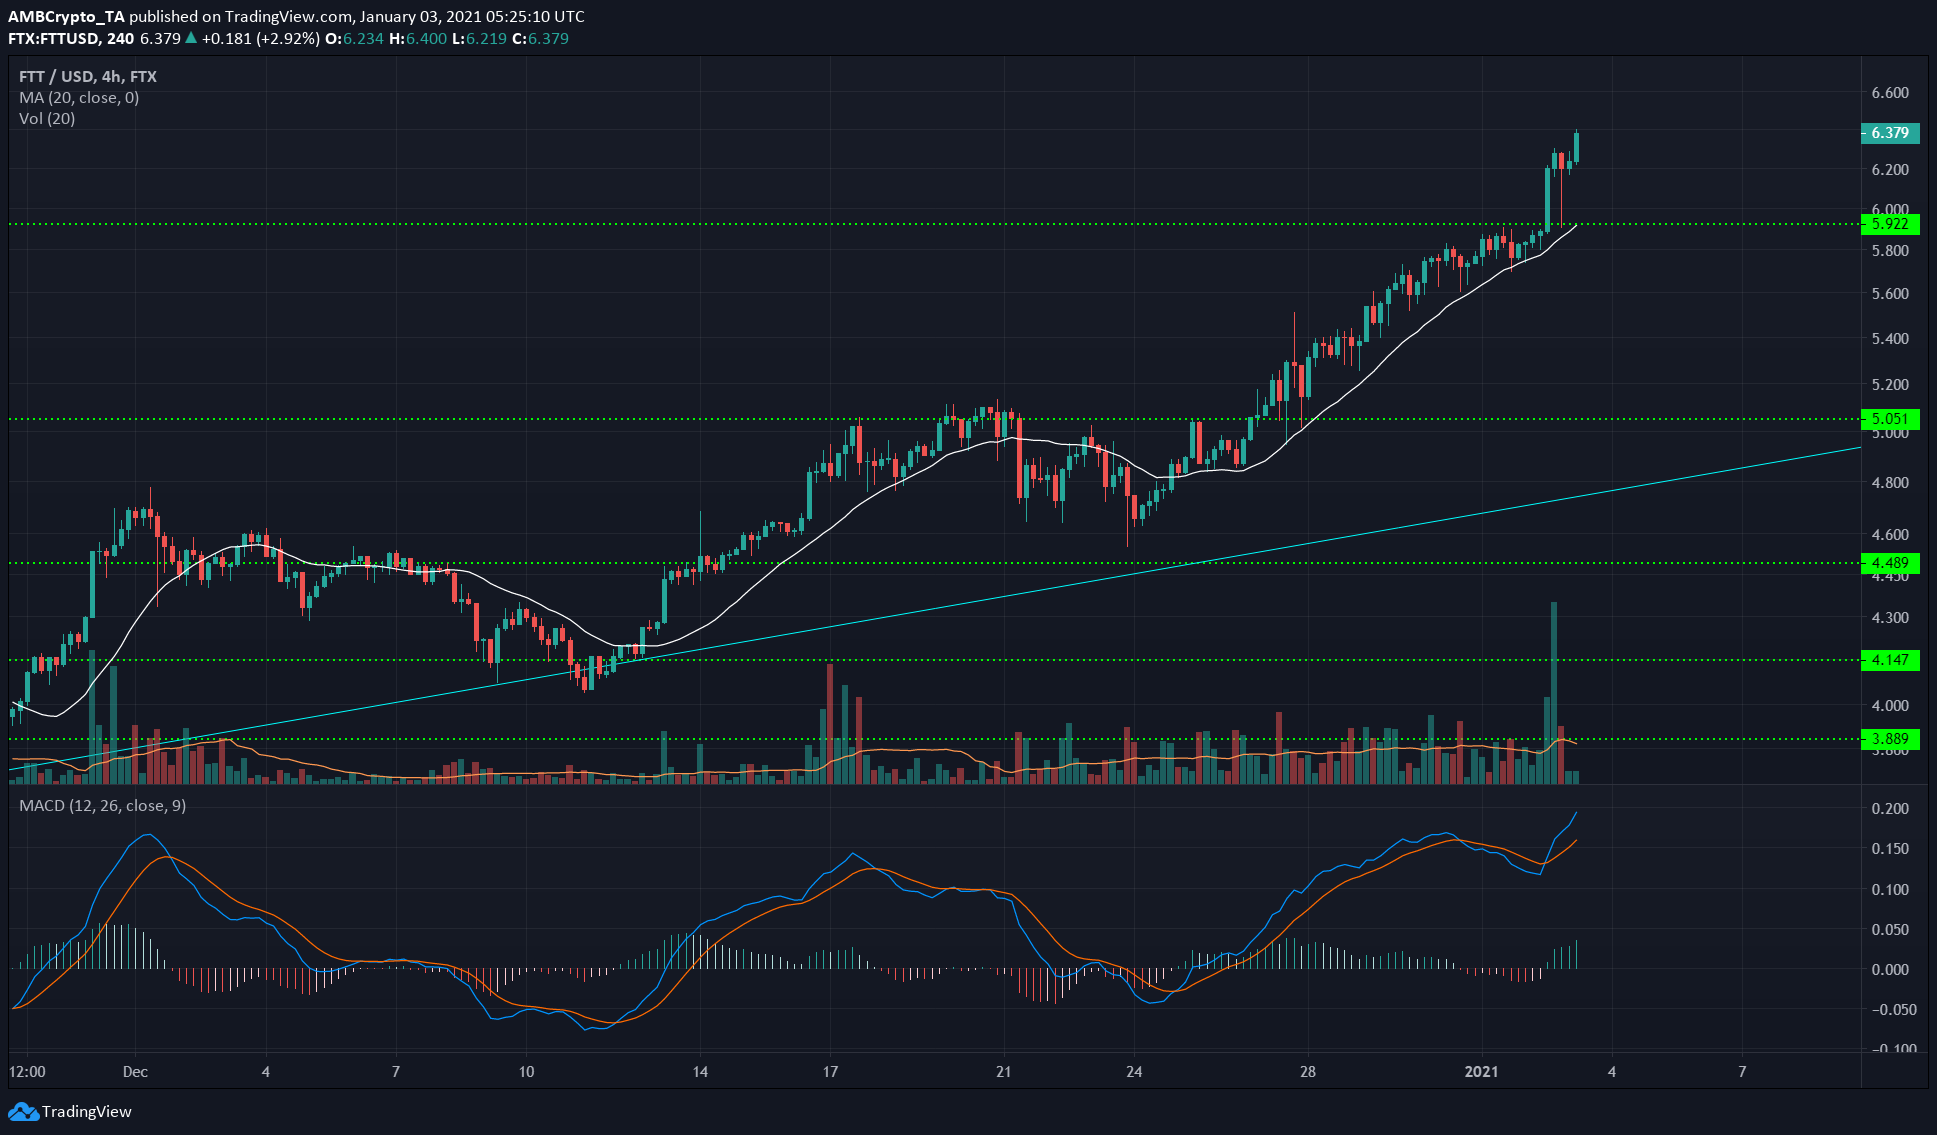
FTT was so bullish that the 20 SMA (white) on the 4-hour chart has been unable to keep up with the price for over a week.
This suggested there might be some overbought sentiment fermenting behind FTT but it has not yet come into play. The most recent trading sessions saw a huge spike in trading volume as the price shot past the $6 mark.
A retracement could see the psychological $6 be retested, or halt at the $6.2 mark above it before continuing upward.
The MACD and the signal line were some distance apart and showed strong bullishness, and there may be some more upside to FTT before a correction.


