Ethereum, Stellar Lumens, VeChain Price Analysis: 14 June

Even though Bitcoin climbed back above $39,000 after a jump of 8% in a single day, not all coins witnessed a surge in value. Alts such as Ethereum, Stellar Lumens and VeChain saw limited gains within their down-channel and awaited further cues for a breakout.
Ethereum [ETH]

Source: ETH/USD, TradingView
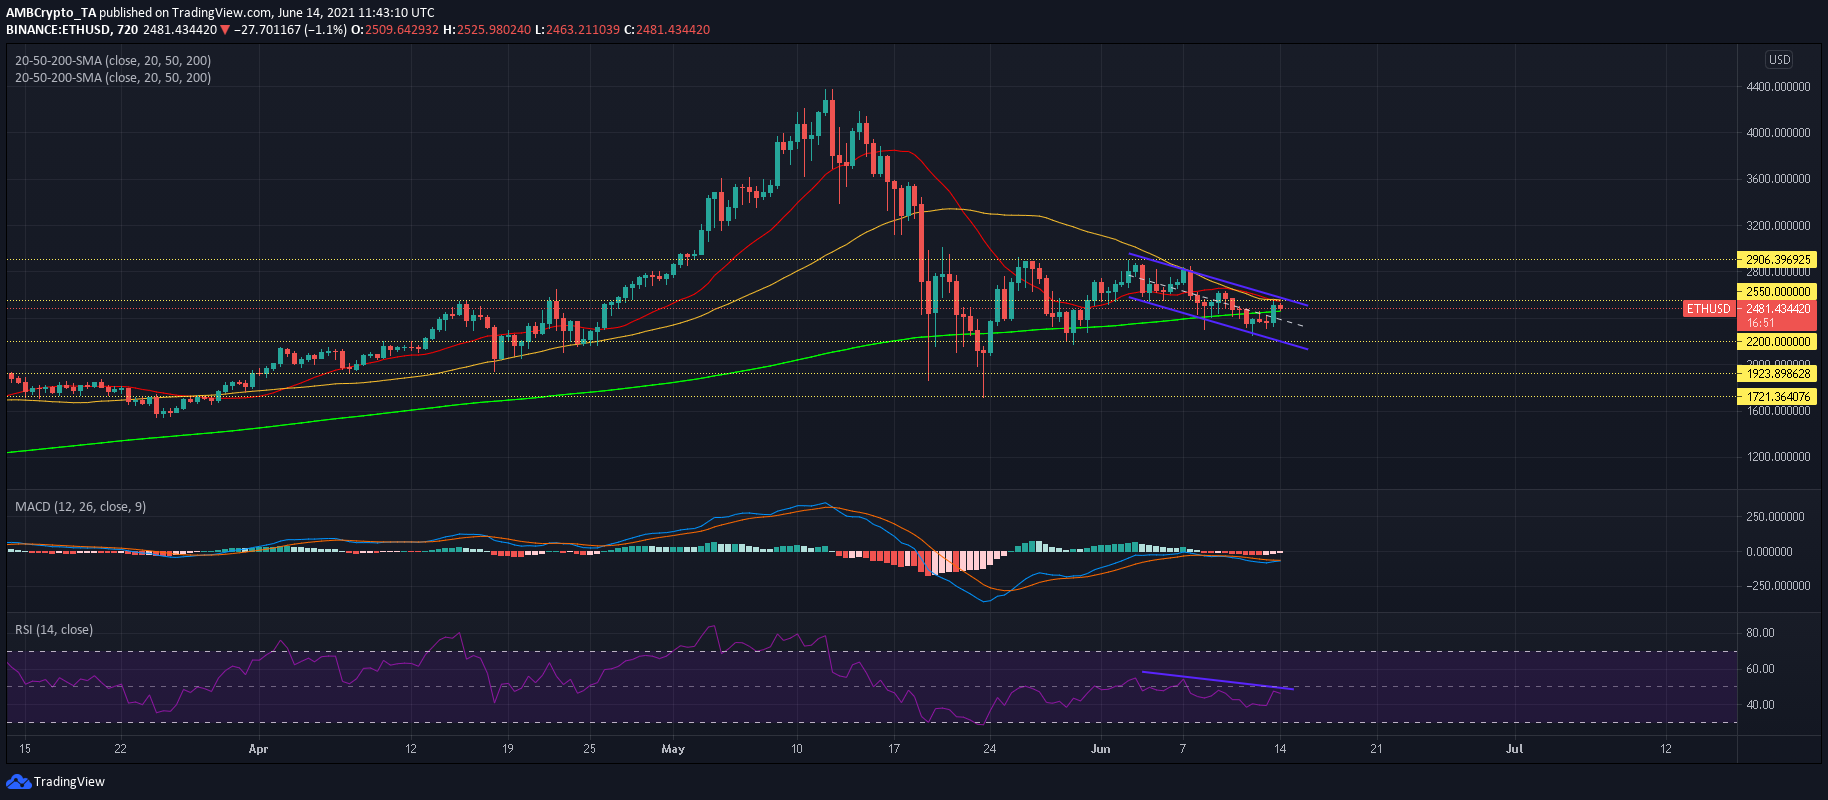
A look at Ethereum’s 12-chart showed the formation of a down-channel after a break above $2,900 was denied by sellers. On the verge of a breakout from the pattern, ETH bulls tussled with the upper trendline at press time. Interestingly, the upper trendline saw some interplay between 20-SMA (red) and 50-SMA (yellow) and hence, it was an important area to retake. A successful breakout would likely result in a 13% hike back towards its upper ceiling of $2,900.
MACD was close to a bullish crossover as the Fast-moving line caught up to the Signal line. However, RSI maintained below 50 and lower highs indicated weakening. A failed breakout would likely see ETH maintain its downtrend within the channel.
Stellar Lumens [XLM]

Source: XLM/USD, TradingView
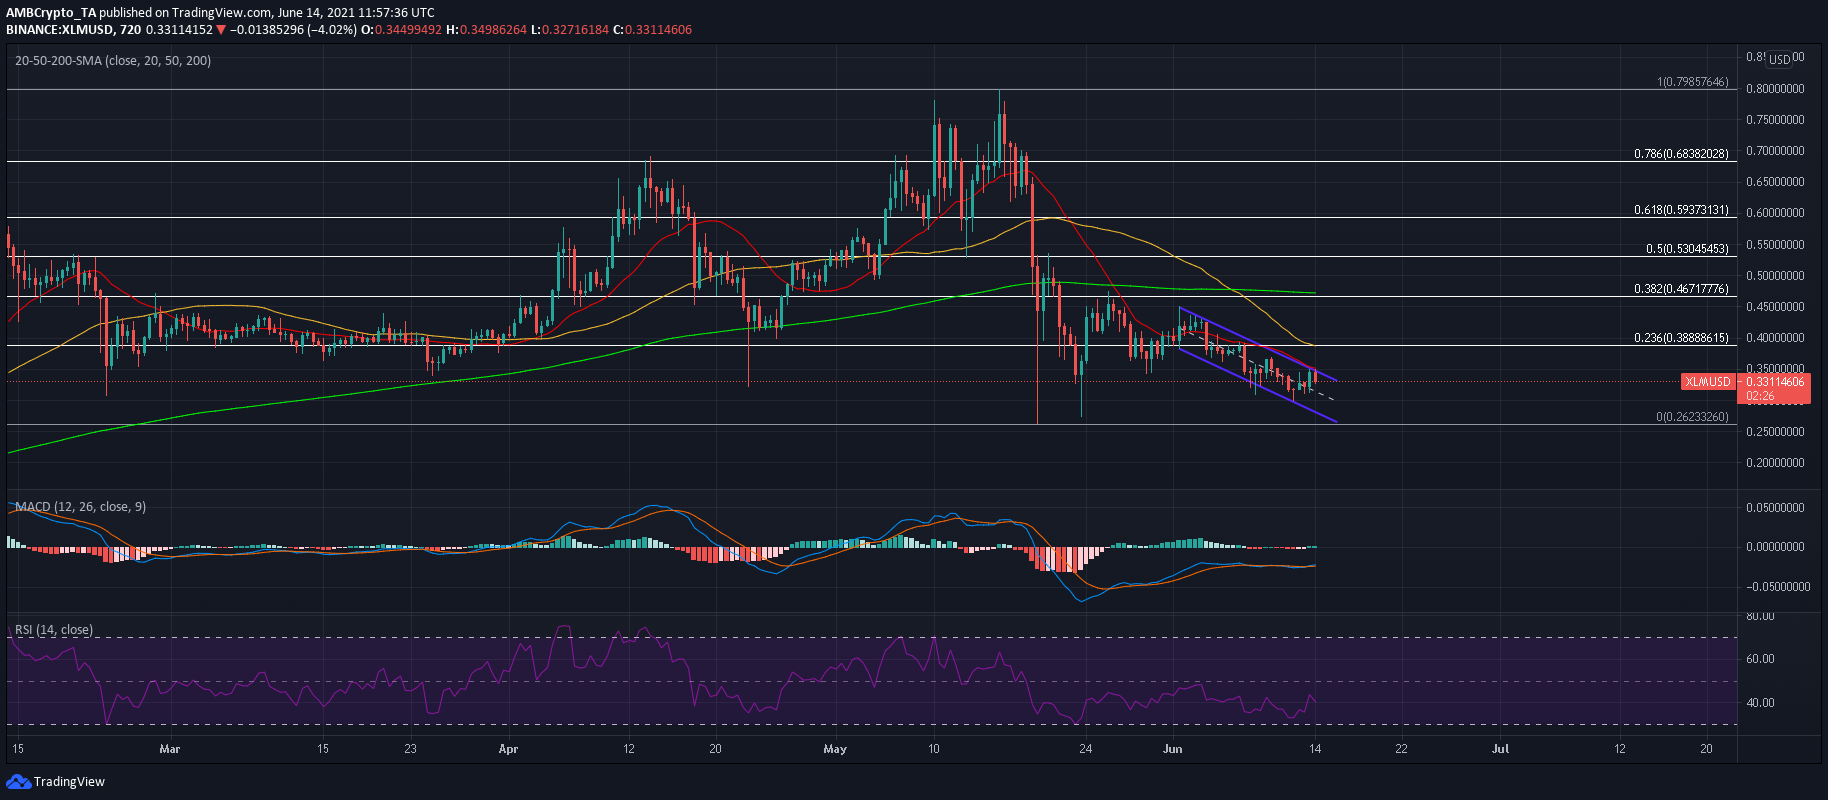
Stellar Lumens also attempted a break above its down-channel at the time of writing. A successful breakout would likely trigger a 13% jump towards 23.6% Fibonacci level ($0.388) and 50-SMA (yellow). An extended bullish outcome could even result in an additional 20% rise at the 38.2% level ($0.46) and 200-SMA (green).
Squeeze Momentum Indicator suggested that bearish momentum has declined over the past few days and backed a favorable outcome. However, RSI has remained in bearish territory since 19th May and even pointed south at press time. The index could continue towards the oversold zone before a reversal can be expected. Such an outcome would see XLM maintain within its down channel over the coming days.
VeChain [VET]

Source: VET/USD, TradingView
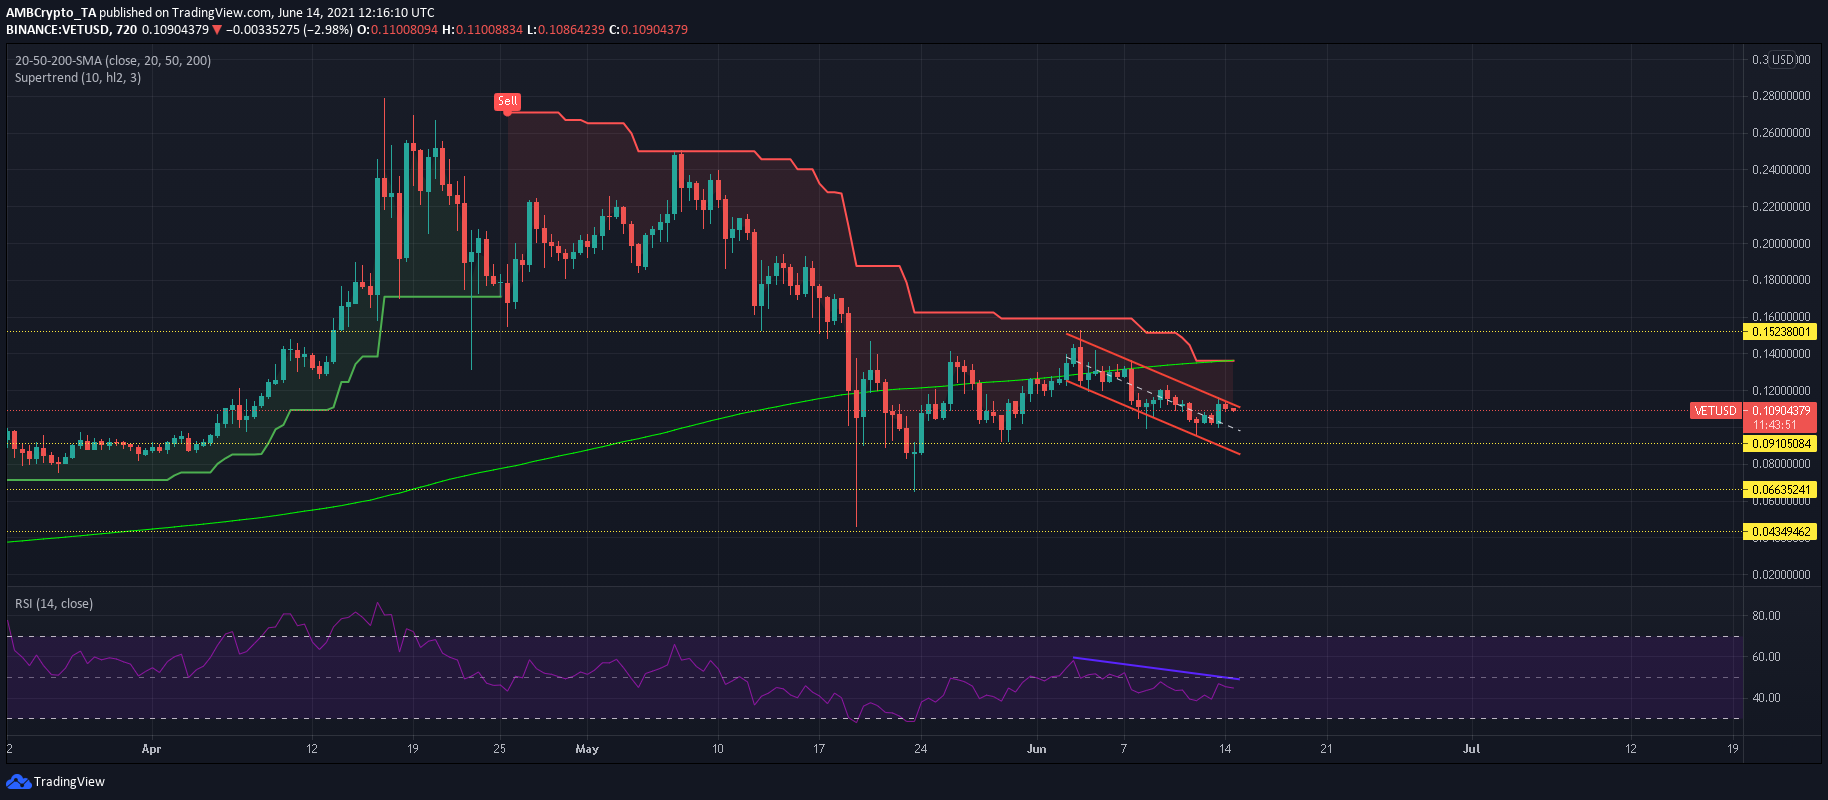
VeChain was in a similar predicament as its counterparts ETH and XLM. The crypto-asset also traded within a down channel and eyed a break above its upper trendline, an area that clashed with 20-SMA (red) and 50-SMA (yellow). An early breakout would likely boost VET towards its 200-SMA, close to strong resistance line of $0.152. If such an outcome is denied, further dips were possible towards defensive lines of $0.091 or $$0.0825. The presence of a demand zone within this area could cushion an extended sell-off.
VET’s RSI gave was an example of yet another altcoin that switched to a downtrend after a key breakout was denied – in this case – $0.152-resistance. The index could decline towards the oversold zone before shifting gears. Supertrend Indicator still presented a sell signal but interestingly placed a stop-loss at $0.136 and 200-SMA- making this area critical to VET’s success.


