Ethereum: U.S. investors look for other altcoins as ETH’s price falls
Ethereum’s Coinbase and Korean Premium Indexes have declined.

- ETH’s Coinbase Premium Index was negative.
- This showed a decline in the coin’s buying activity among U.S.-based investors on Coinbase.
Ethereum’s [ETH] price decline since briefly trading above $4000 on the 11th of March has resulted in a drop in its Coinbase Premium Index (CPI), according to CryptoQuant’s data.
This metric measures the difference between an asset’s prices on Coinbase and Binance. When its value grows, it suggests significant buying activity by US-based investors on Coinbase.
Conversely, when it declines and dips into the negative territory, it signals less trading activity on the US-based exchange.
At press time, ETH’s CPI was -0.008. CryptoQuant’s data showed that when the altcoin’s price fell below $3200 on the 18th of March, its CPI cratered to a 30-day low of -0.1.
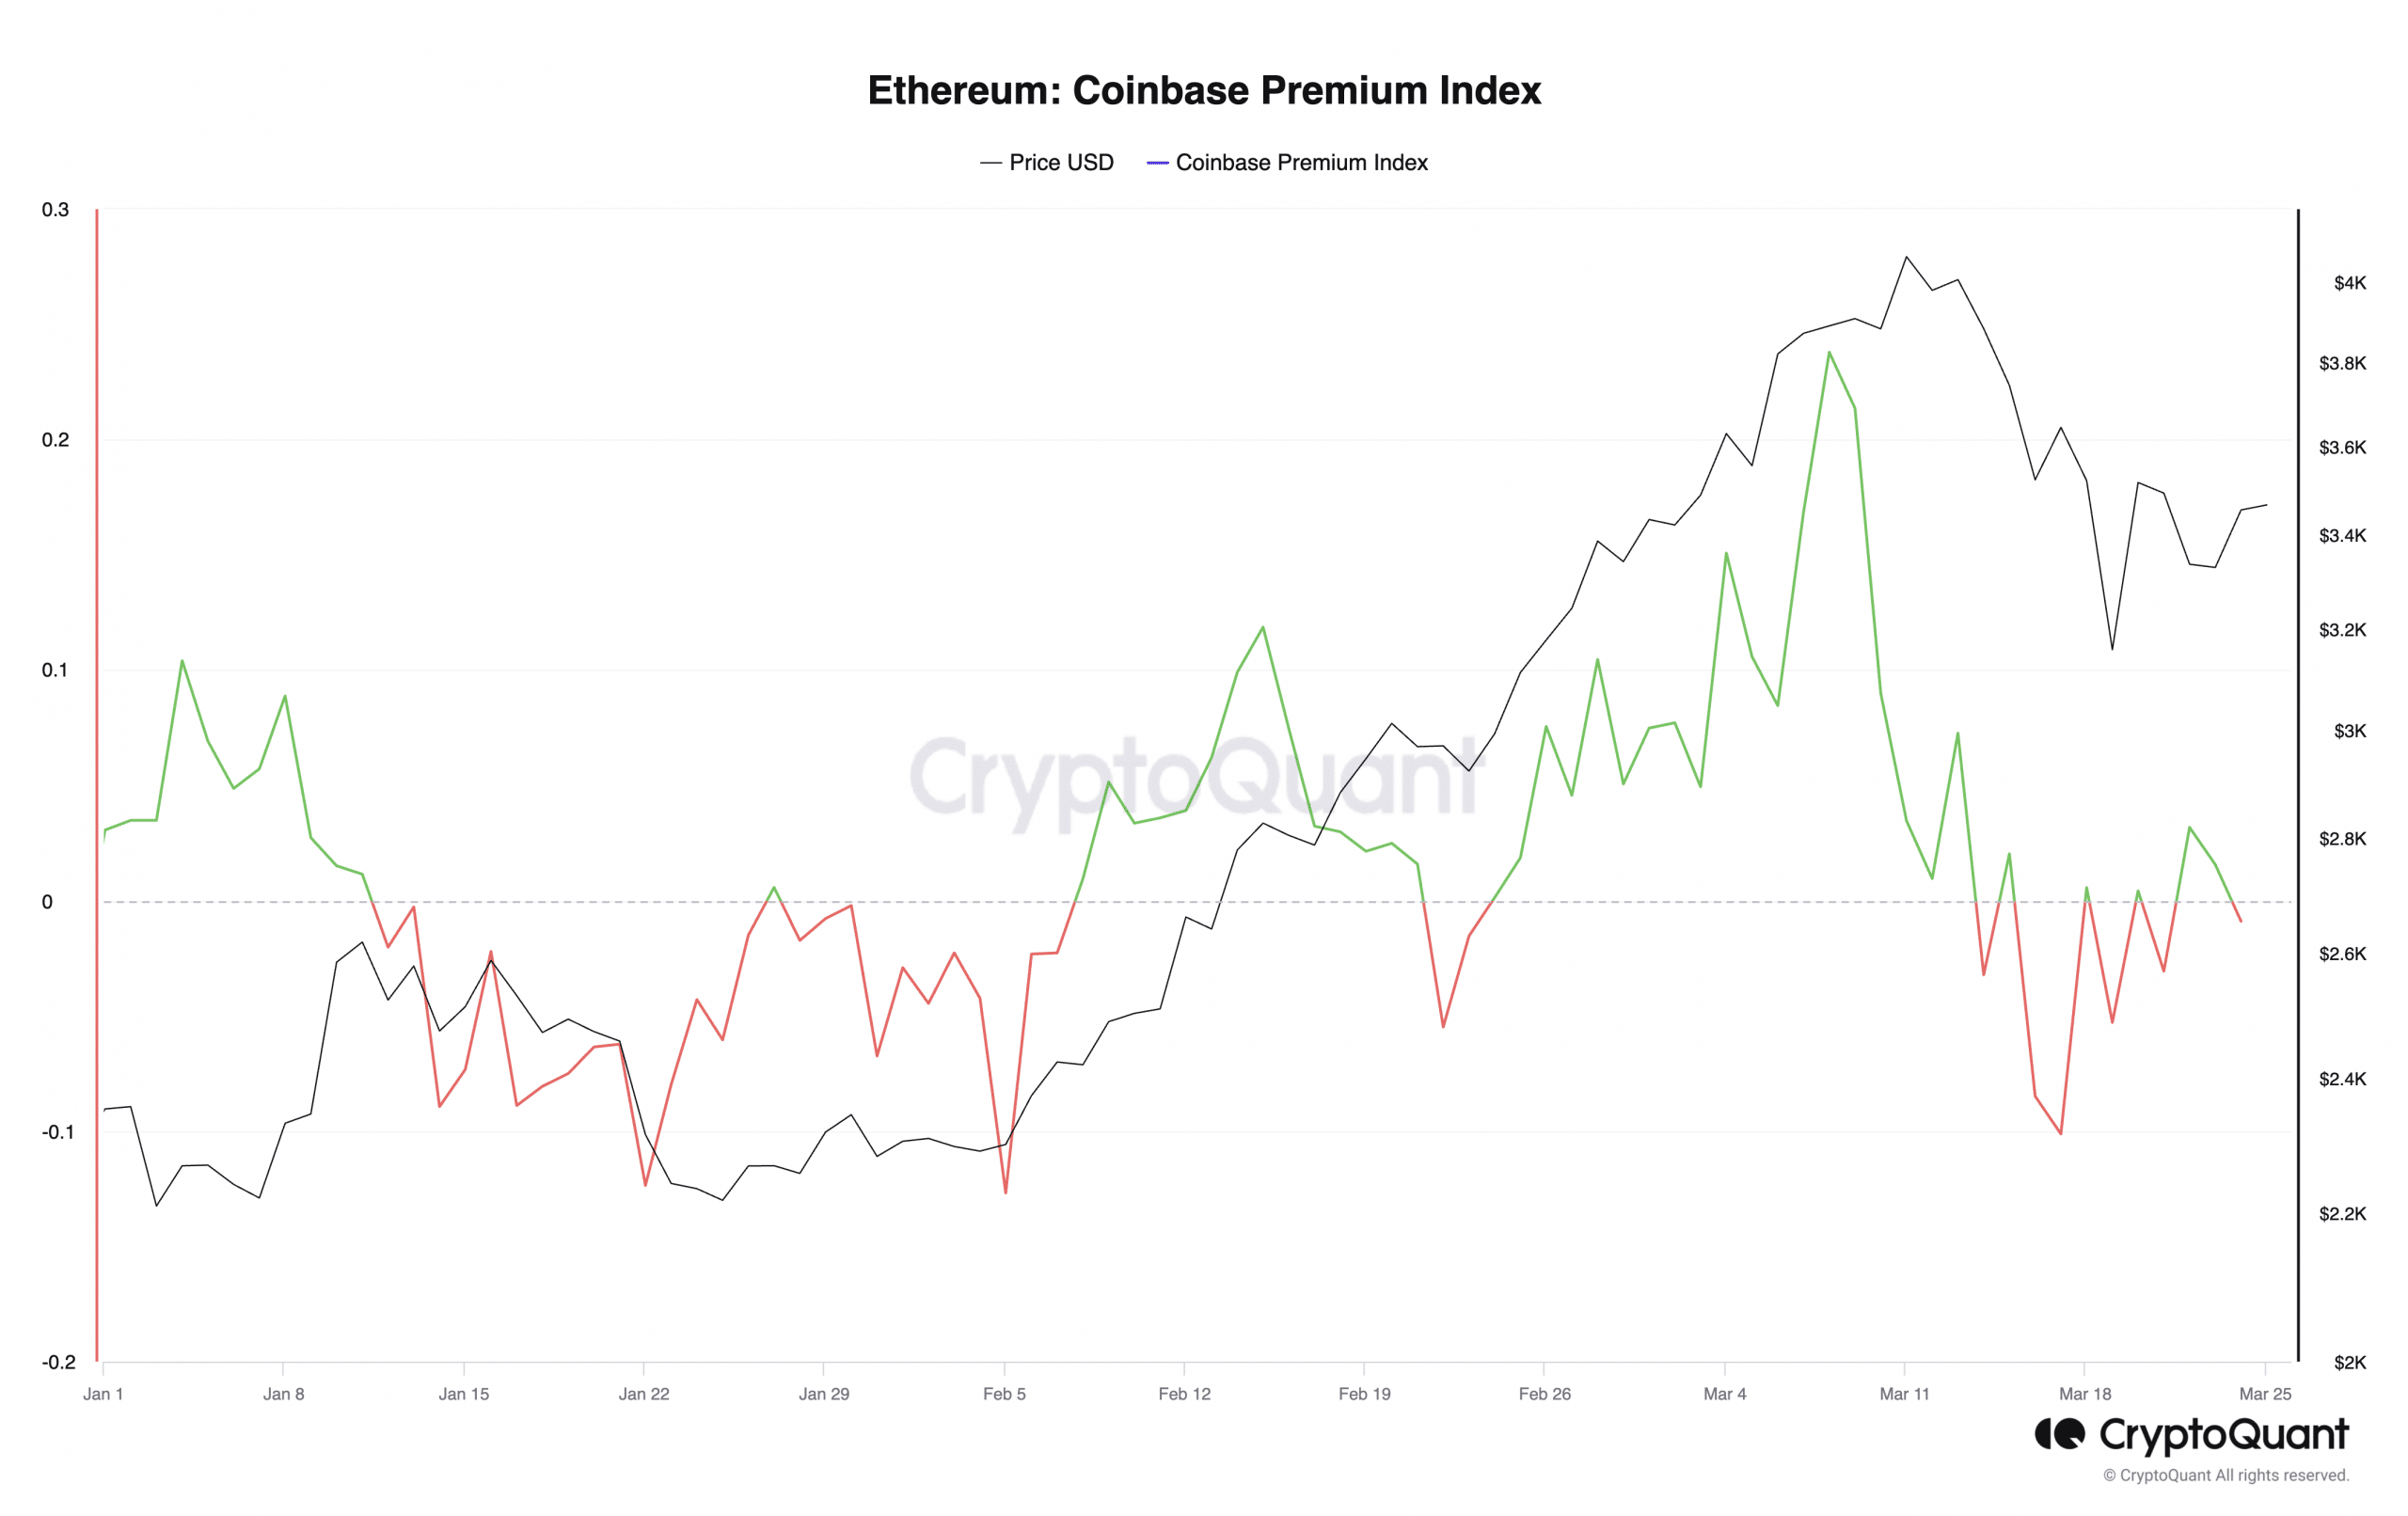
The coin’s CPI has declined in the last few weeks after rallying to a 12-month high at the beginning of March.
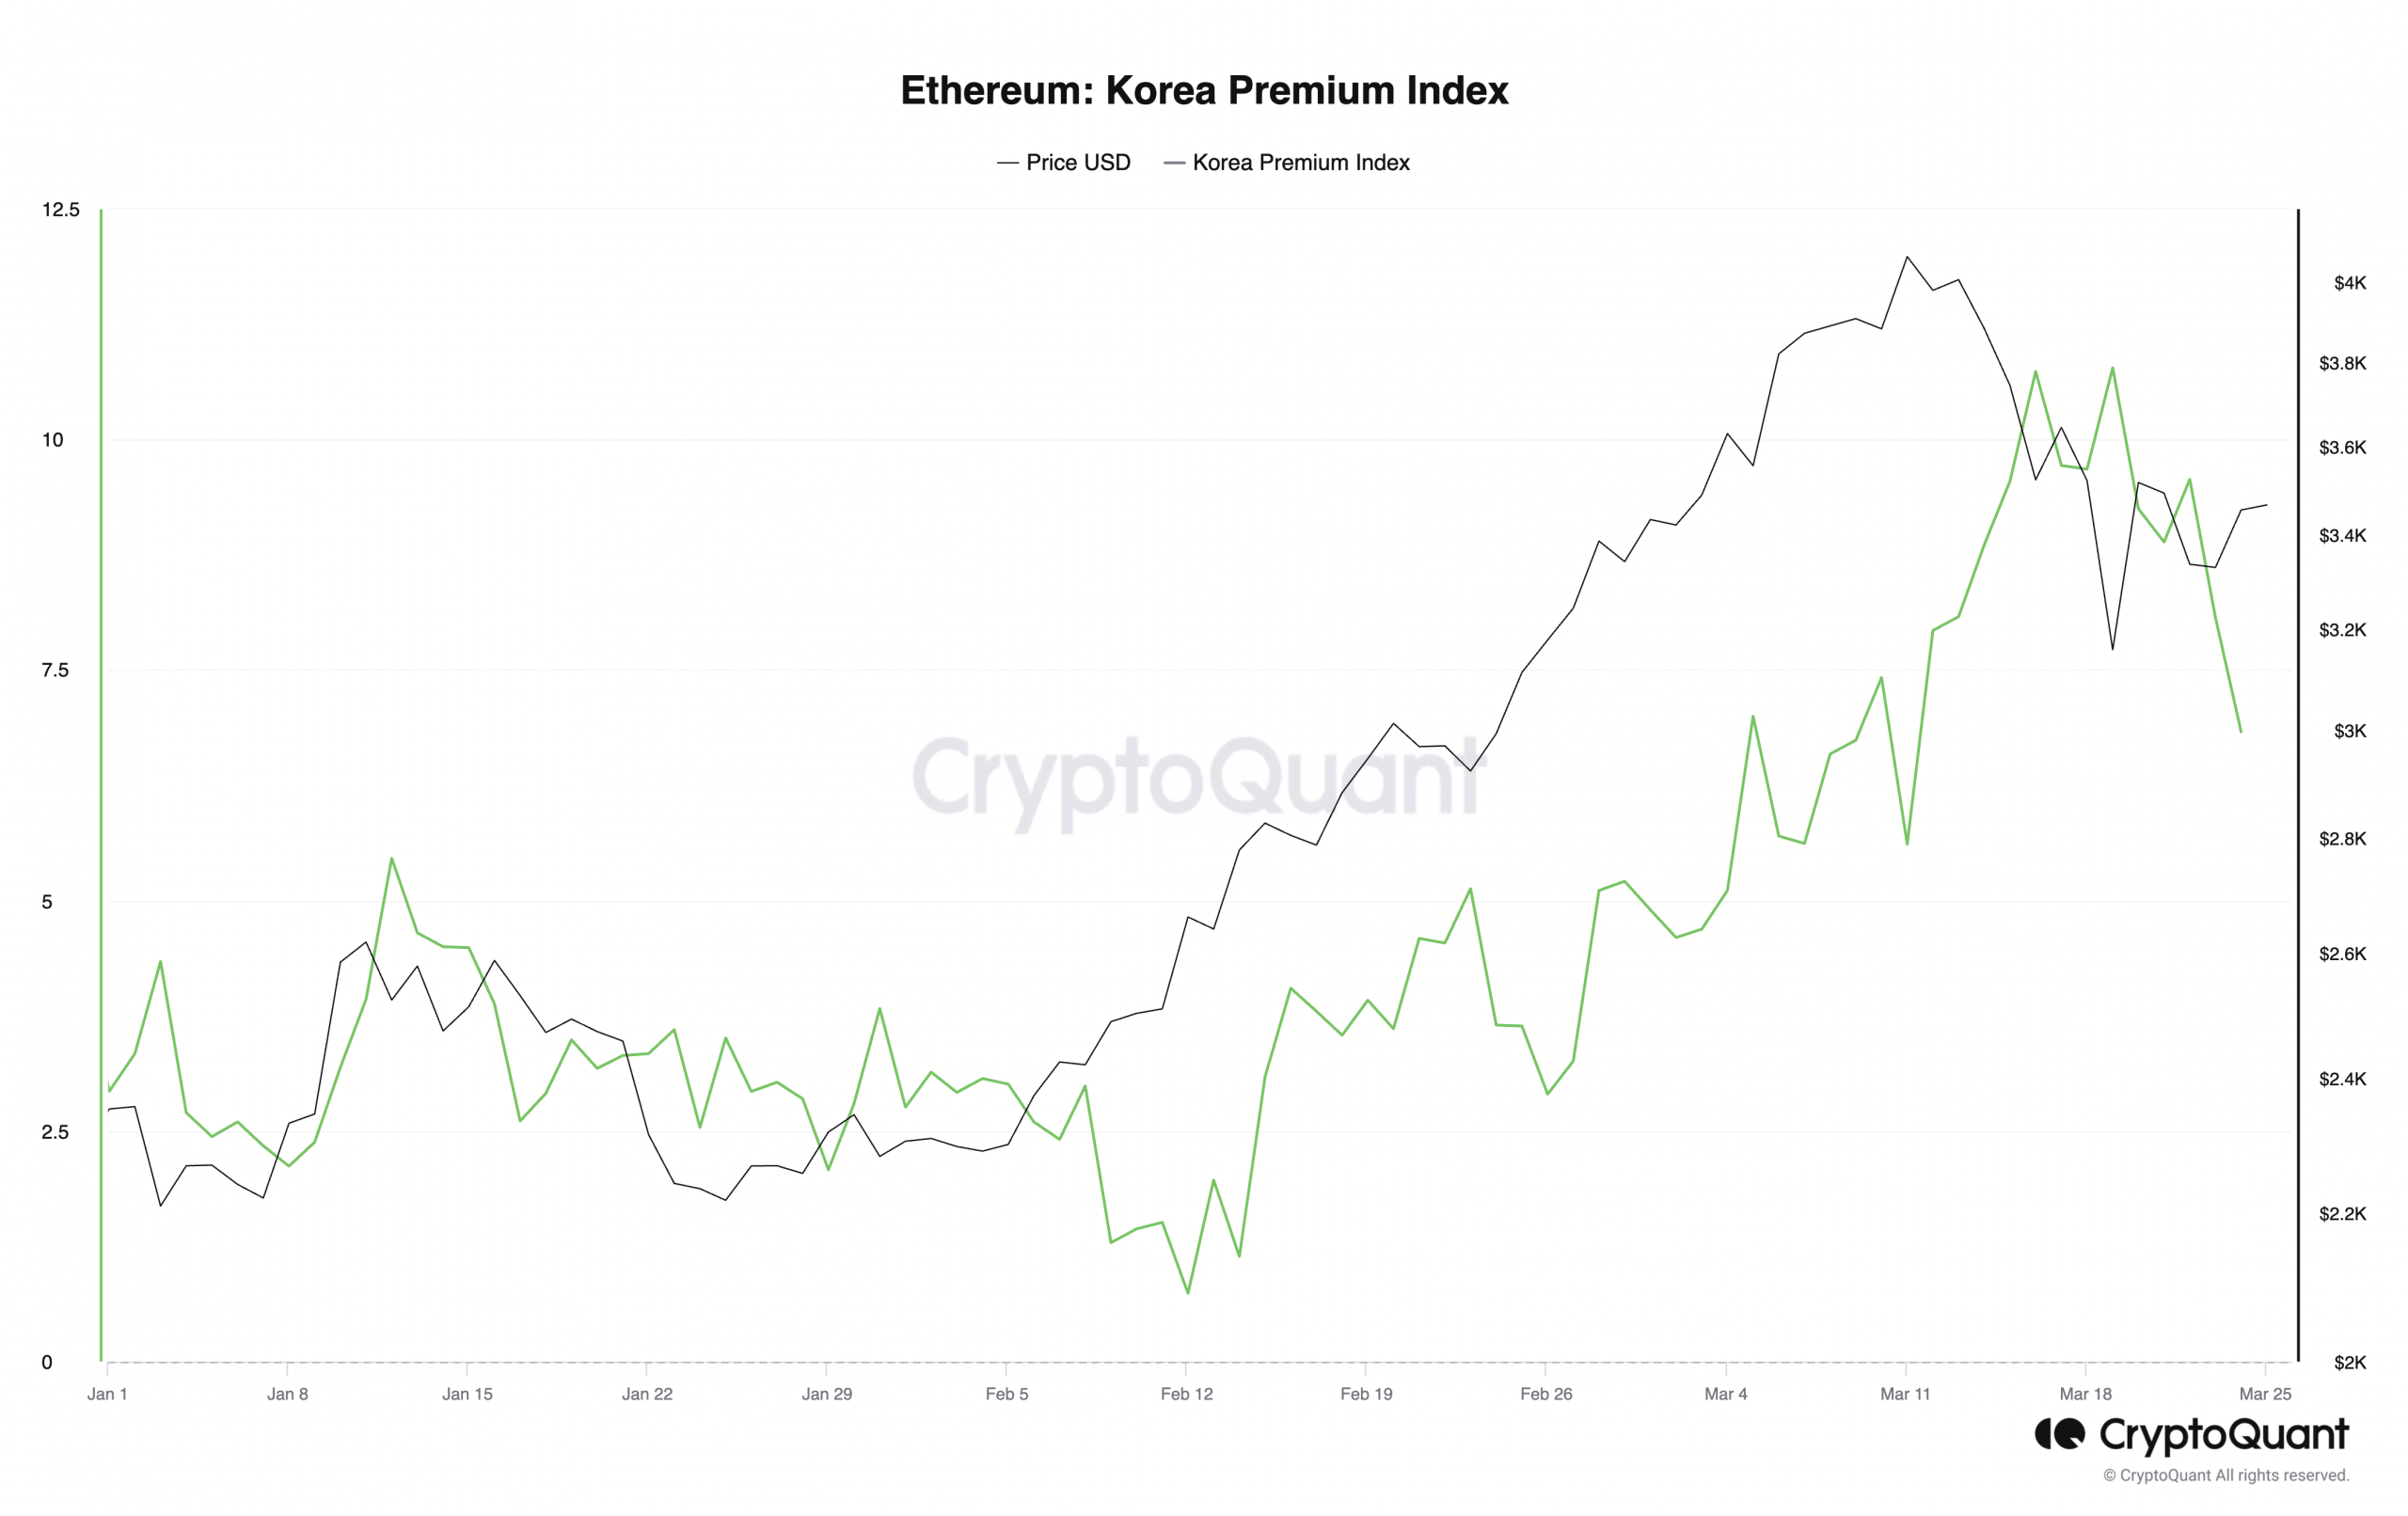
Although the Asian markets follow a similar trend, an assessment of ETH’s Korean Premium Index (KPI) showed that it remains positive despite the price pullback in the past few weeks.
At press time, ETH’s KPI was 6.83.
The bears aim to extend ETH’s losses
AMBCrypto’s assessment of ETH’s price performance on a daily chart hinted at the possibility of a decline in the coin’s value this week.
As of this writing, the altcoin exchanged hands at $3,474, witnessing a 4% price decline in the last week.
The coin’s Money Flow Index (MFI) was spotted at a low of 39.34. This indicator measures the strength of money flowing in and out of an asset.
At a value of 39.34, ETH’s MFI suggested that the coin was witnessing a decline in buying pressure.
Confirming the decrease in demand for the coin, its Relative Strength Index (RSI) trended downward to return a value of 49.
This also showed that selling activity outpaced coin accumulation among spot market participants.
Further, ETH’s Parabolic SAR revealed that the bearish sentiment has been significant since the 15th of March.
Is your portfolio green? Check out the ETH Profit Calculator
It has been positioned above ETH’s price in the past 10 days, during which the coin’s value has dropped by 6%.
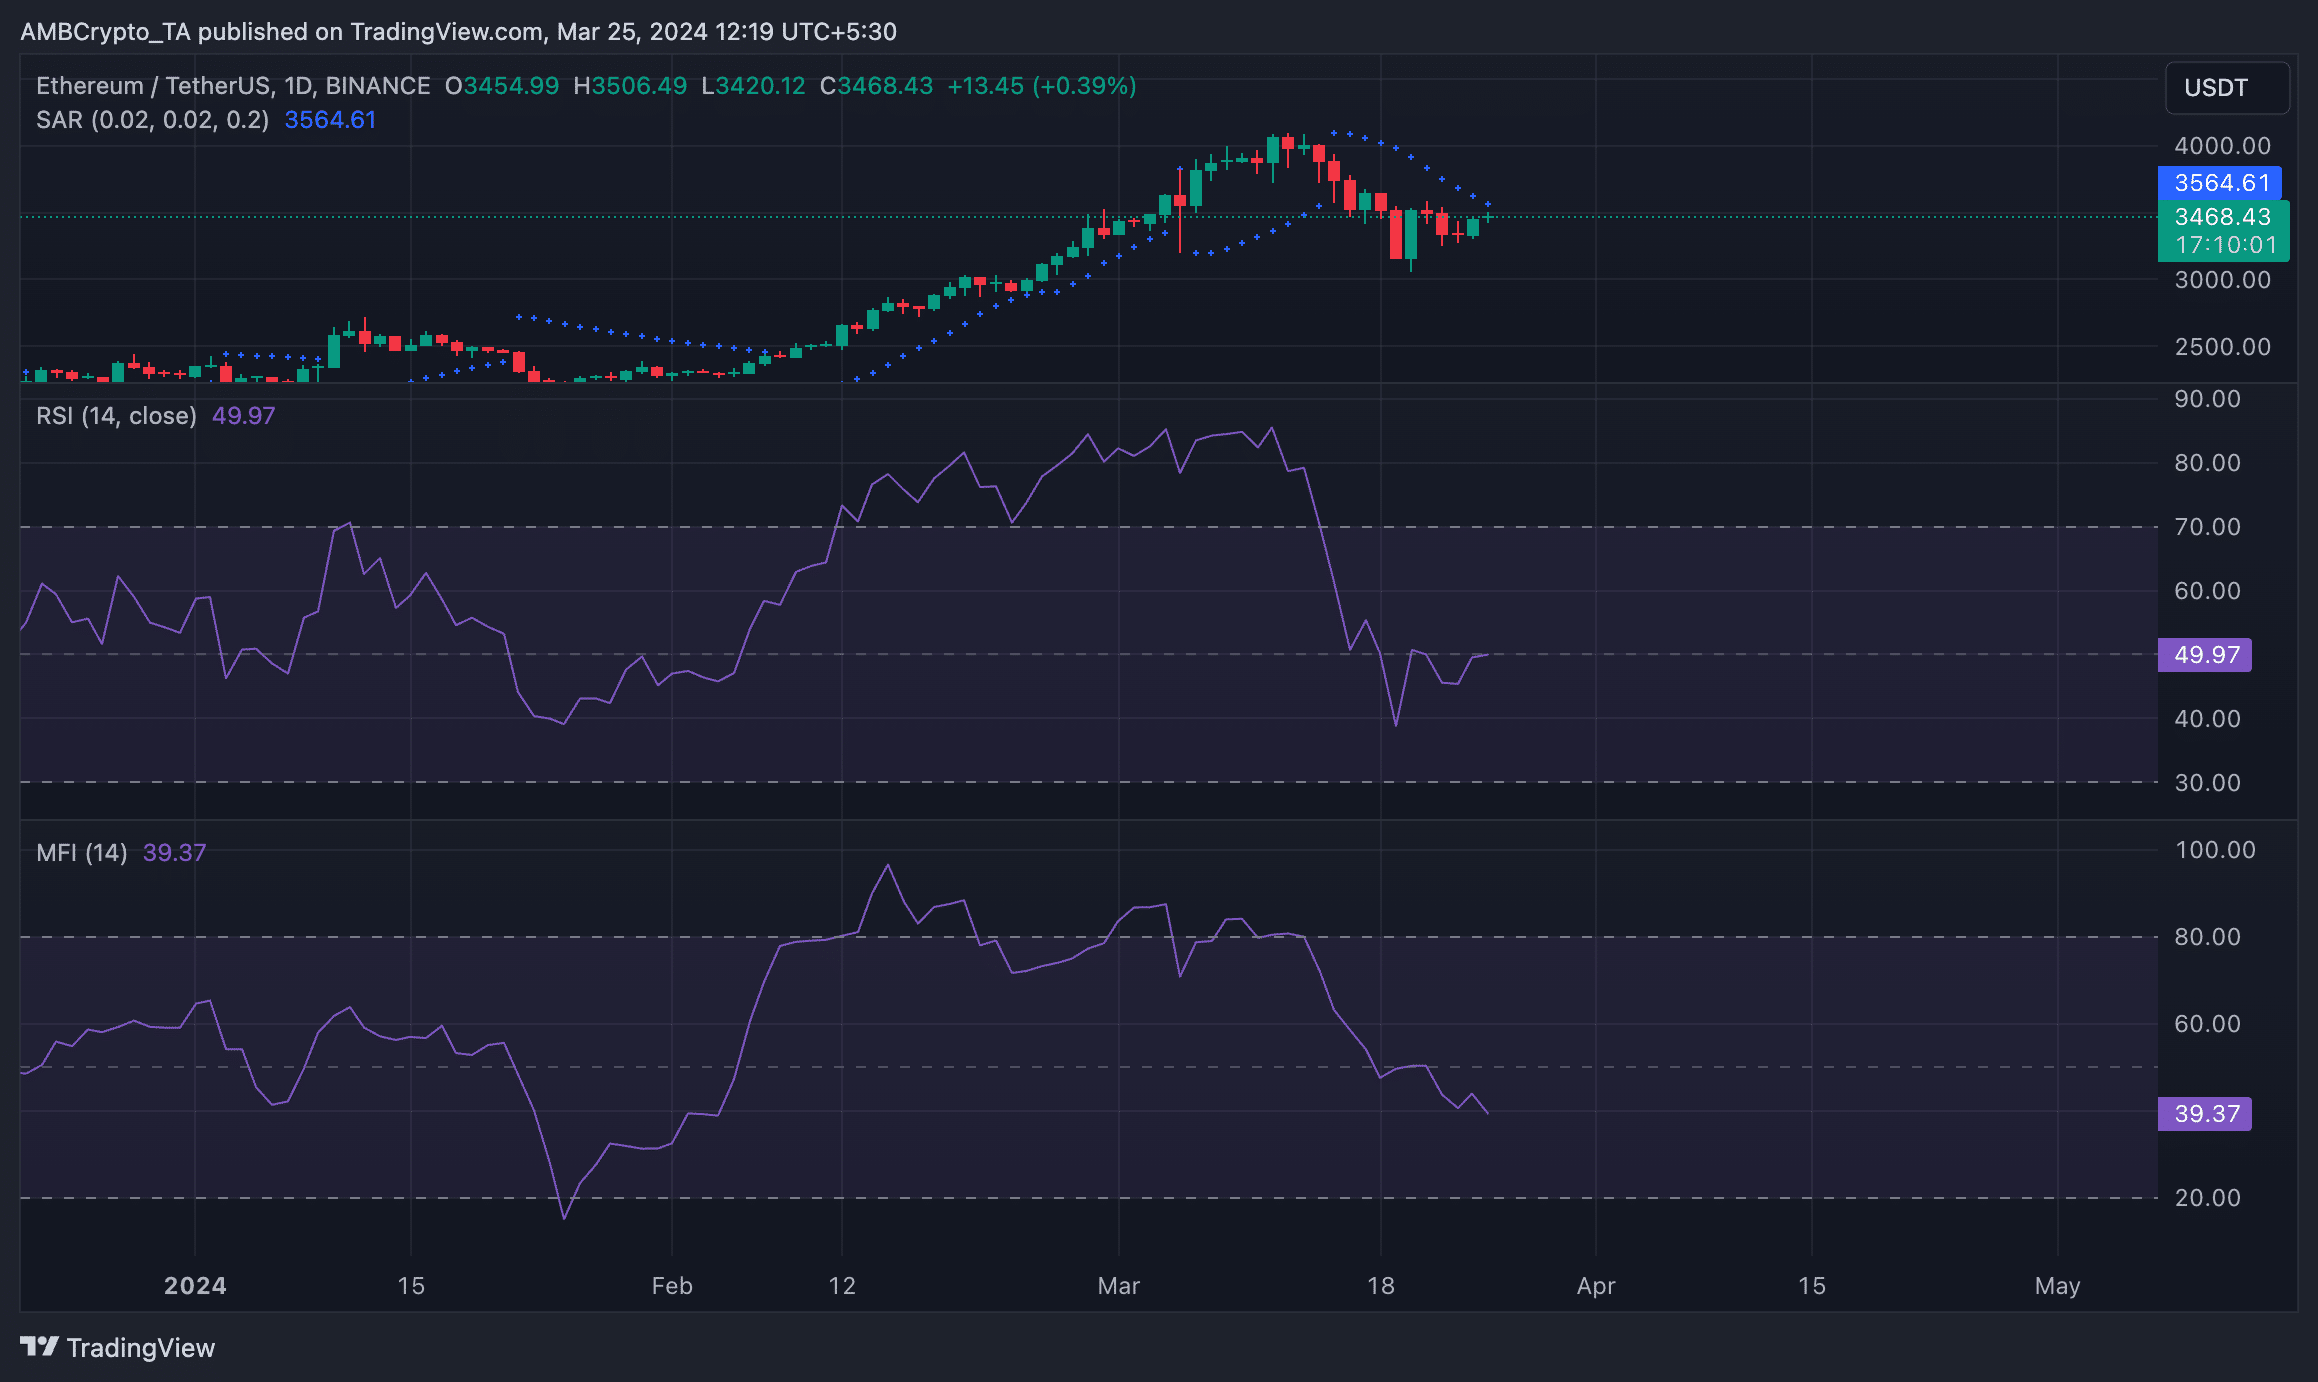
The Parabolic SAR indicator tracks potential trend direction and reversals. When its dotted lines rest above an asset’s price, the market is deemed to be in a downtrend.