Ethereum: Unraveling ETH’s breakout possibilities to maximize returns

Disclaimer: The findings of the following analysis are the sole opinions of the writer and should not be considered investment advice.
- Ethereum’s recent continuation chart pattern could present buying opportunities.
- The crypto noted a substantial increase in its network growth as the metric matched its yearly highs.
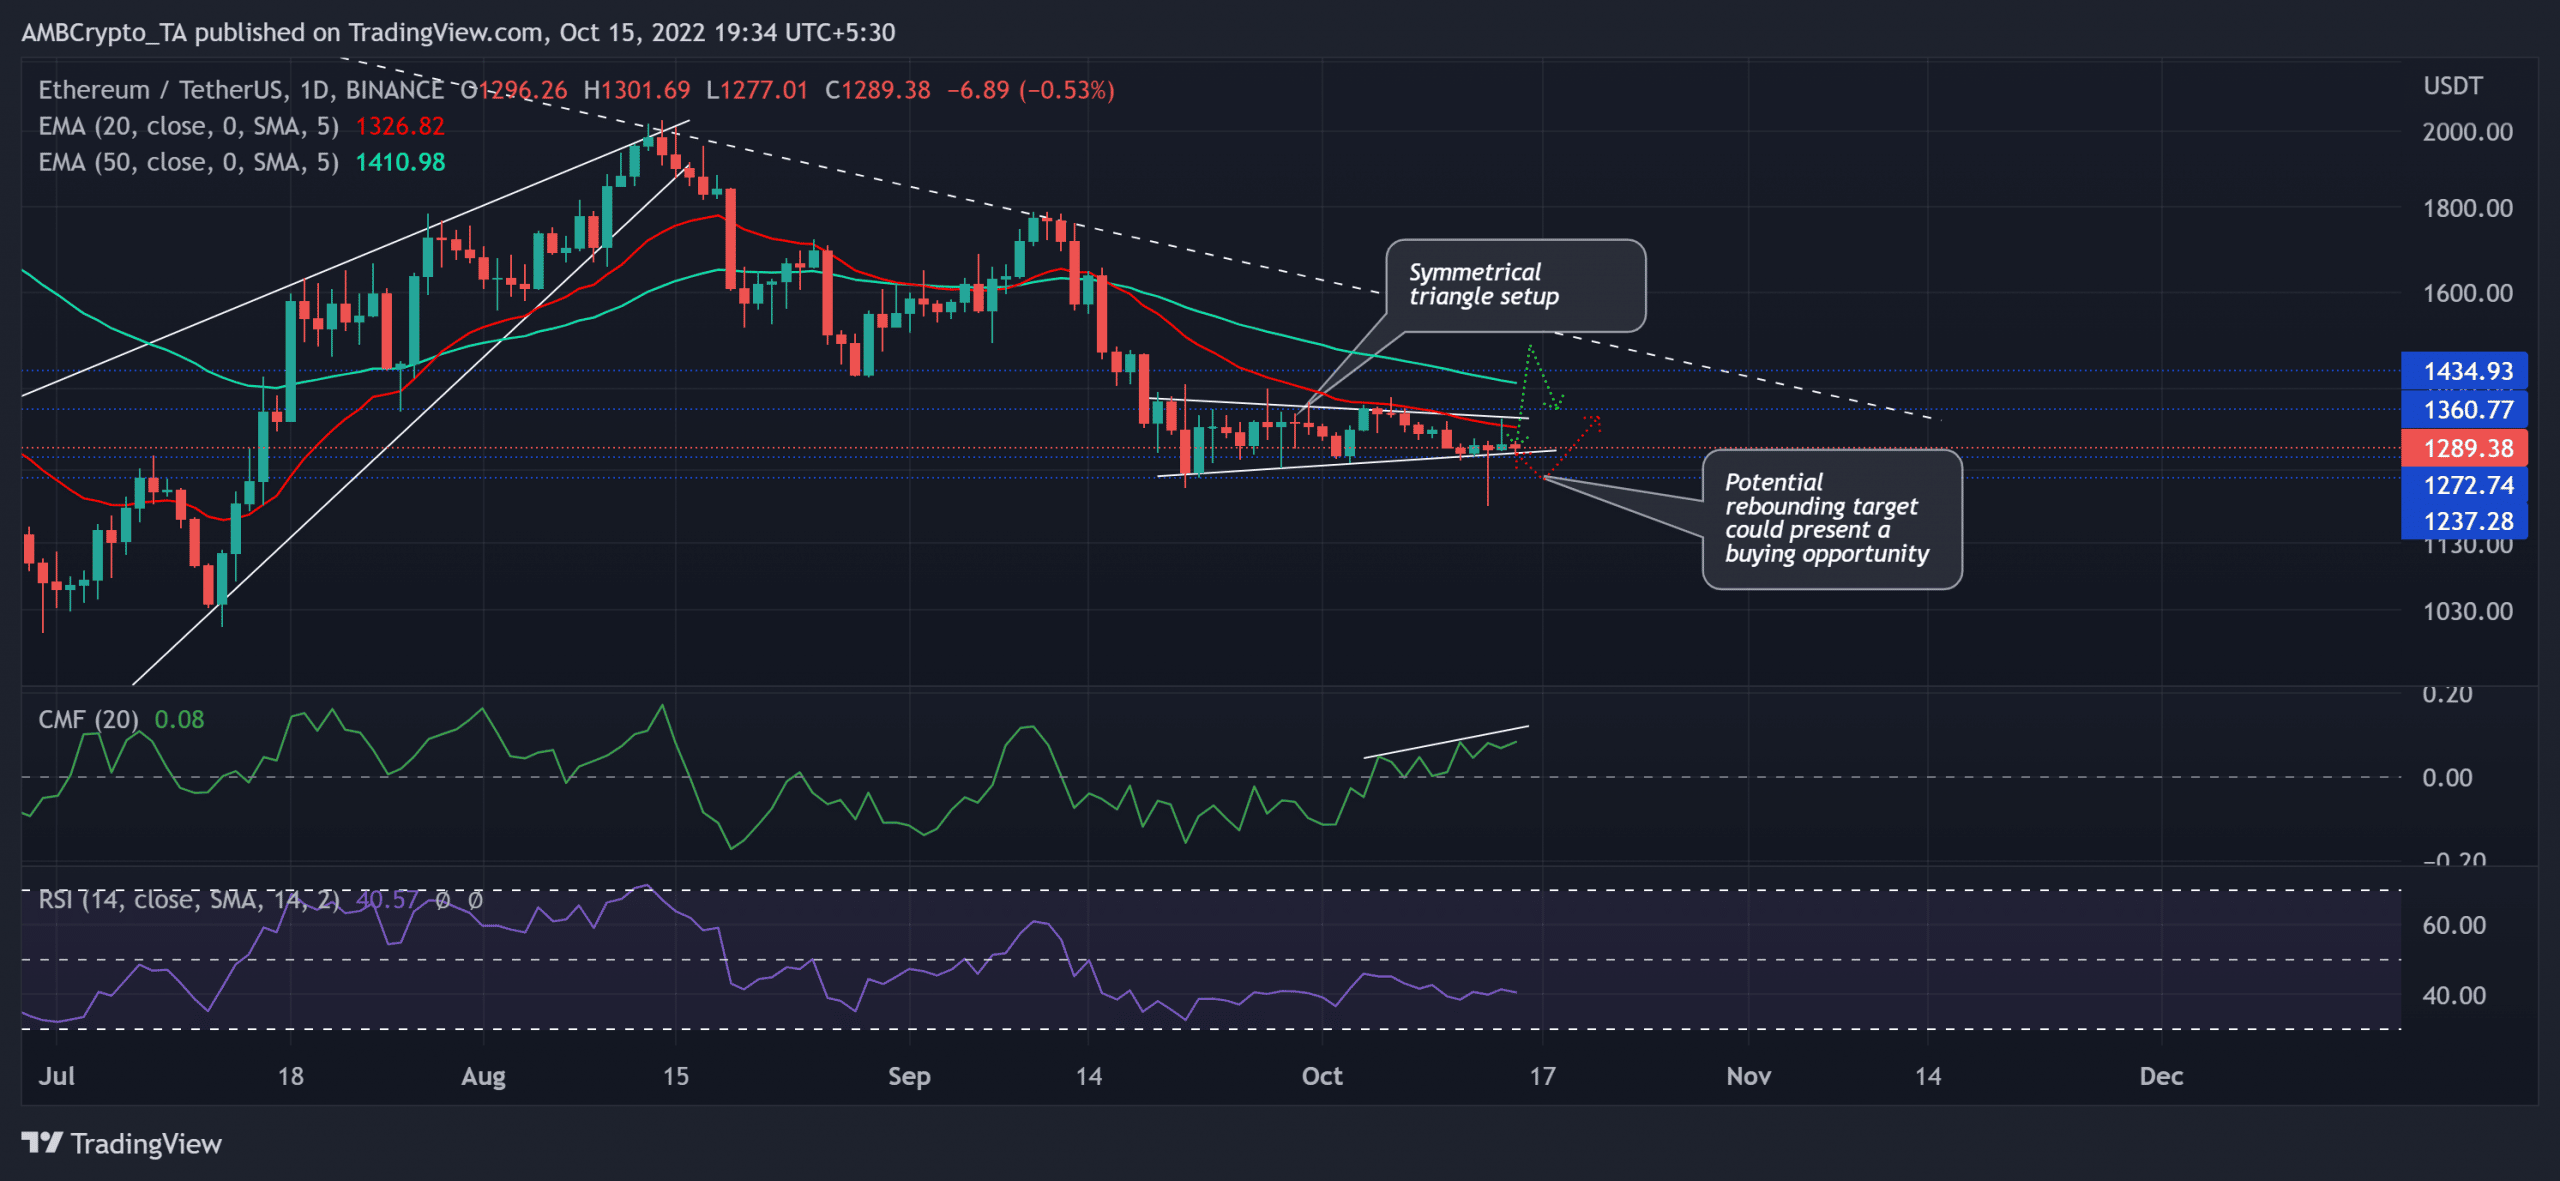
Ethereum [ETH] registered double-digit losses over the last month after an expected reversal from its trendline resistance (white, dashed). The subsequent decline below the 20 EMA (red) and the 50 EMA (cyan) positioned the king alt within the constraints of its bearish shackles.
Here’s AMBCrypto’s price prediction for Ethereum [ETH] for 2023-24
Should the $1,272 support stand sturdy, it could invalidate the default bearish inclinations. At press time, ETH was trading at $1,289.38.
After breaking down from its rising wedge in the daily timeframe, ETH bears renewed their pressure to sustain a consistent downtrend. As a result, ETH lost over 30% of its value in the past two months.
The recent price movements chalked out a symmetrical triangle after a steep downtrend. Generally, a symmetrical triangle acts as a continuation pattern. Consequently, a decline below the lower trendline of the triangle could expose the crypto to a near-term decline before a lift-off.
This decline could open gateways for a retest of the $1,230 support zone. The buyers could then strive to look for a near-term rebound.
On the other hand, an immediate break above the 20 EMA and the upper trendline of the triangle would hint at a bearish invalidation. In these circumstances, the potential targets would lie in the $1,434-$1,520 range.
The Chaikin Money Flow (CMF) depicted a bullish edge after its sway above the zero mark. But its higher troughs bearishly diverged with the price action. Furthermore, the Relative Strength Index (RSI) continued to display a bearish edge after failing to break above the midline.
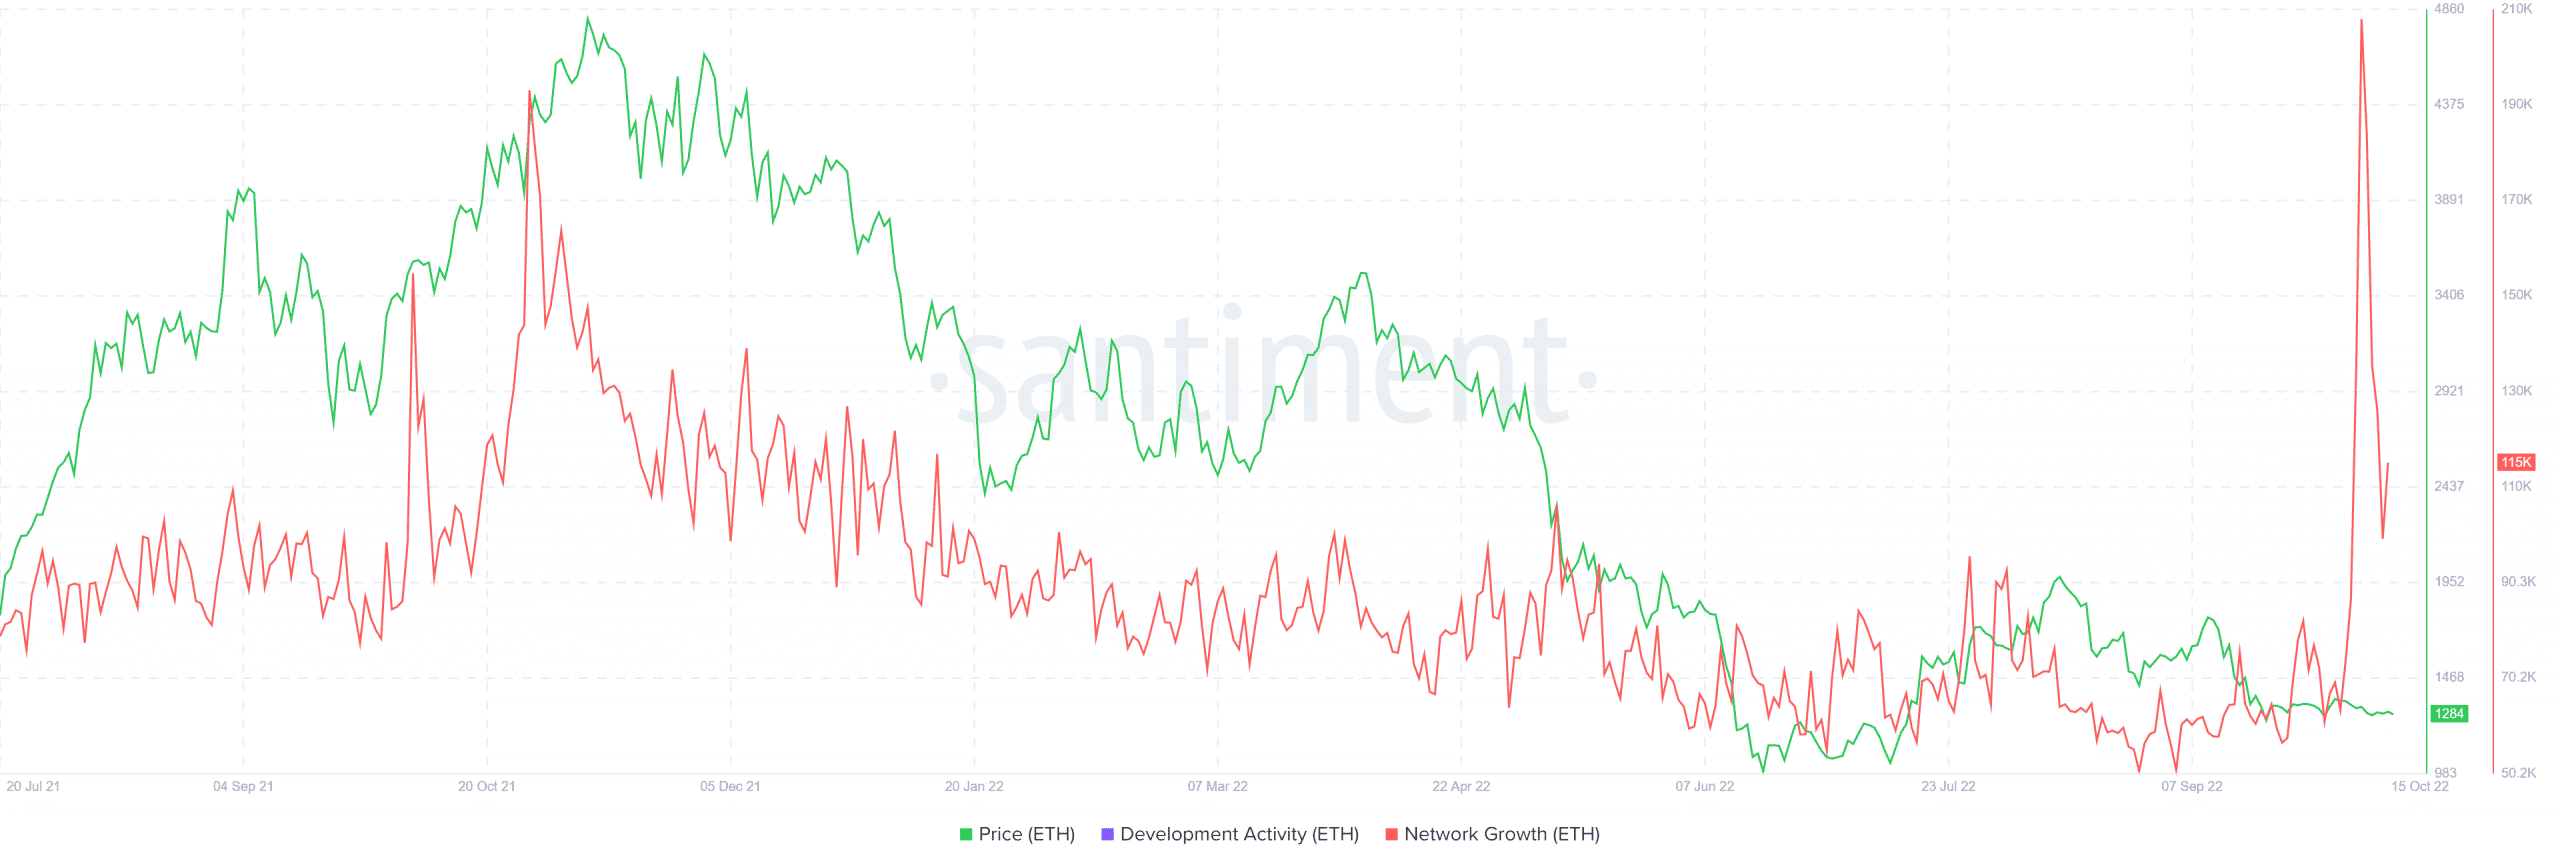
Over the last year, ETH’s price has shown relatively high sensitivity toward its Network Growth. Interestingly, over the last few days, its Network Growth hiked to match its November 2021 highs. On the contrary, the price action was yet to follow. From a rather long-term perspective, should the price follow, the buyers could trigger strong accumulation.
Finally, investors/traders must watch out for Bitcoin’s [BTC] movement. This is because ETH shares a 68% 30-day correlation with the king coin.


